


Data Science Articles
Hypothesis Testing: A Beginner's Guide for Data Scientists
Pandas Advanced Techniques for Data Scientists
Data Warehouse vs. Data Lake vs. Lakehouse: What's the Difference?
SQL Window Functions: Practical Examples Every Analyst Needs


Get In Touch For Details! Request More Information

Association Rule in Data Science: A Complete Guide (2026)
Sep 03, 2026 5 Min Read 5455 Views
(Last Updated)
Association rule in data science is a method used to find hidden relationships between items in large datasets. It works by spotting patterns, such as when customers buy a laptop, they also tend to buy a mouse.
This kind of insight is widely used in retail, recommendation systems, and even healthcare data. Businesses rely on it to understand customer behavior and make smarter decisions without manually digging through mountains of data.
Table of contents
- TL;DR Summary
- What is the Association Rule in Data Science?
- Key Concepts of Association Rule in Data Science
- Support, Confidence, and Lift: Measures of Association Rule
- Support, Confidence, and Lift: Quick Comparison
- Association Rule Mining Algorithms
- Apriori Algorithm
- Eclat Algorithm
- Applications of Association Rule in Data Science
- Interactive Challenge: Put Theory Into Practice
- Conclusion
- FAQs
- What is an association rule in data science?
- What are the benefits of using association rules in data mining
- What is the difference between support and confidence?
- What algorithms are used for association rule mining?
- Where is association rule mining used in real life?
TL;DR Summary
- Association rule in data science helps uncover hidden relationships between items in large datasets, showing how the presence of one item relates to another.
- Support, confidence, and lift are the three core measures used to judge how frequent, reliable, and strong a rule is.
- Apriori and Eclat are the two most common algorithms used to mine association rules from transactional data.
- Retailers, recommendation engines, and healthcare systems use association rule in data science to spot patterns and make smarter, data driven decisions.
- Understanding these concepts helps you move from raw data to practical insights, without needing to manually sort through massive datasets.
Association rule mining was first introduced in 1993 by Rakesh Agrawal and his team at IBM, in a research paper that laid the foundation for modern market basket analysis.
What is the Association Rule in Data Science?
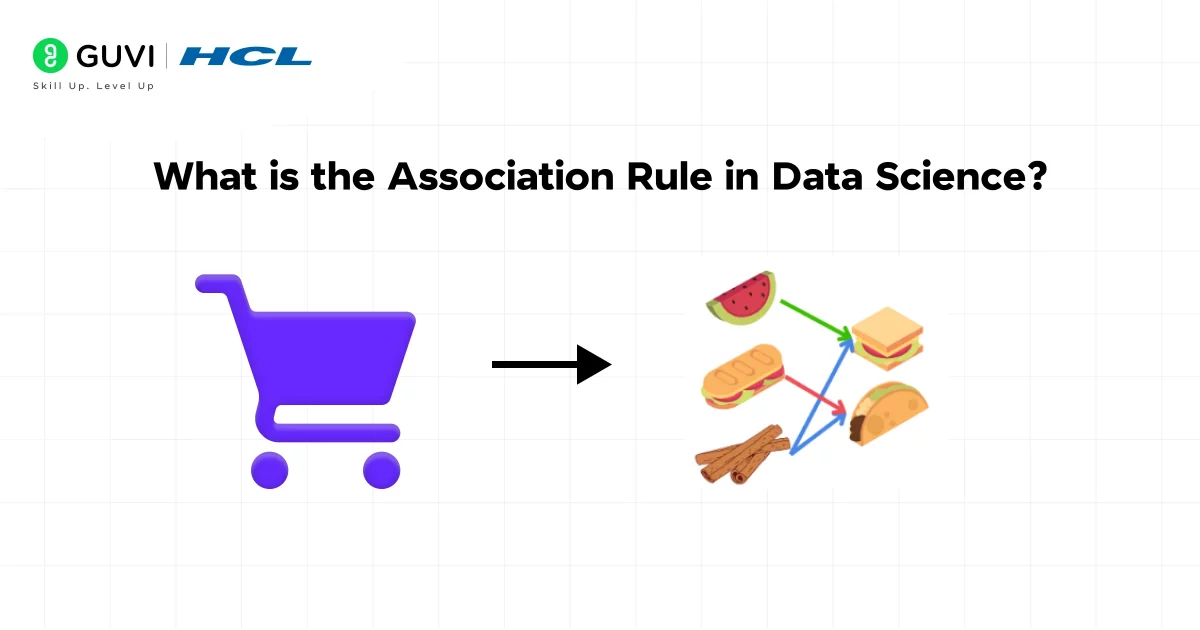
Association rule in data science is a rule-based data mining technique for discovering interesting relationships between variables in large datasets. It is best known for market basket analysis, where retailers look for items that are frequently bought together.
At its core, association rule in data science works in two main steps:
(1) find frequent itemsets that meet a minimum support threshold, and (2) generate “if-then” rules from those itemsets that meet a minimum confidence threshold.
For example: Given a transaction dataset, we might discover the frequent itemset {Milk, Bread, Butter} and then form the rule {Milk, Bread} ⇒ {Butter}, meaning “customers buying milk and bread often also buy butter.”
Each such rule is scored by measures like support, confidence, and lift (defined below) to gauge its strength and usefulness.
Ready to master association rules and the rest of data science in depth? The HCL GUVI Advanced Data Science Course gives you live mentor led classes, 10+ real world projects, IITM Pravartak certification, and placement support with 1000+ hiring partners. Learn Python, machine learning, and generative AI from scratch, in English, Hindi, Telugu, or Tamil. Enroll today and turn your data science curiosity into a career.
Key Concepts of Association Rule in Data Science
In association analysis, we treat each record (e.g., a shopping basket) as a transaction, which is a set of items. An itemset is any subset of items. An itemset is called frequent if it appears in at least a specified fraction (the minimum support) of all transactions.
For example, if “Milk” appears in 30 out of 100 transactions, its support is 30%. If our minimum support is 20%, “Milk” is a frequent 1-itemset.
After identifying frequent itemsets, we form association rules of the form X ⇒ Y, where X and Y are disjoint itemsets. This rule is interpreted as “if a transaction contains X, it often contains Y too.” In this rule, X is the antecedent (left-hand side), and Y is the consequent (right-hand side).
For example, a rule could be {Milk, Bread} ⇒ {Butter}. The task of association rule learning is to find all such high-quality rules that have sufficient support and confidence.
Support, Confidence, and Lift: Measures of Association Rule
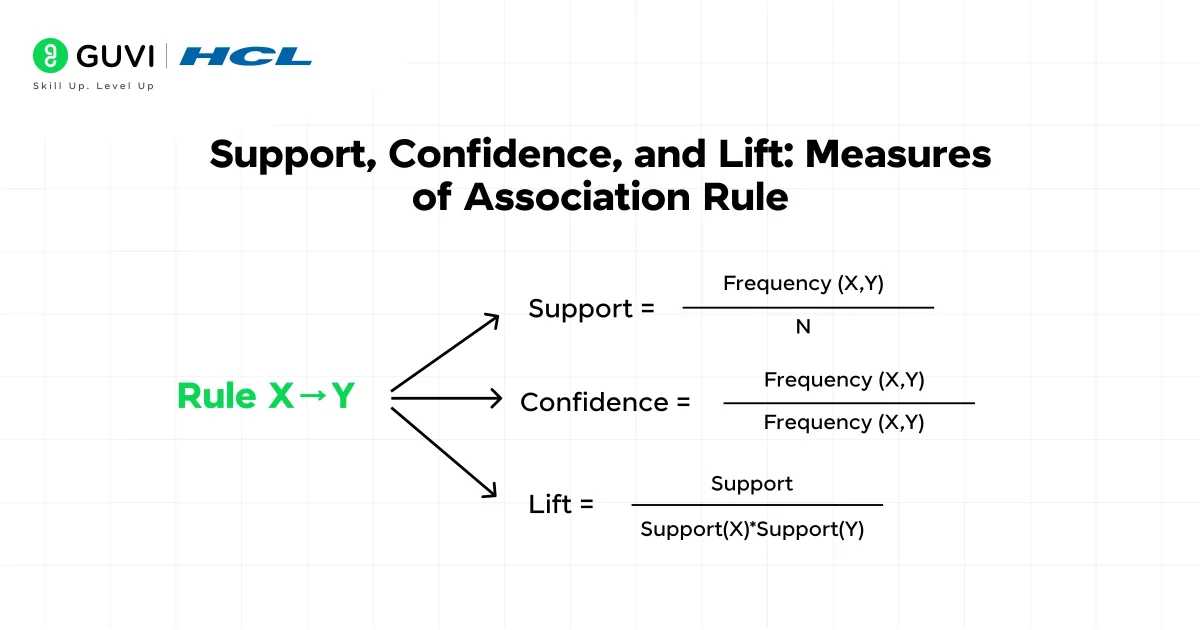
These are the three key metrics measure the quality of an association rule:
Three key metrics measure the quality of an association rule in data science.
A. Support
Support of an itemset X is the fraction of all transactions that contain X.
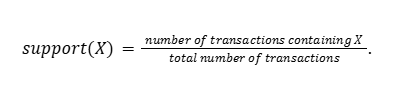
Support(X) = (Transactions containing X) / (Total transactions)
Higher support means X occurs frequently. For example, if 25 out of 200 sales include Milk, the support of {Milk} is 12.5%. We often use a minimum support threshold (say 5% or 10%) to focus on itemsets that are common enough to be interesting.
B. Confidence
Confidence of a rule X⇒Y measures how often items in Y appear among transactions that contain X.

Confidence(X⇒Y) = Support(X∪Y) / Support(X)
This is the conditional probability P(Y | X). For instance, if 15 transactions contain {Milk, Bread} and 12 of those also include Butter, then confidence({Milk, Bread}⇒{Butter}) = 12/15 = 80%. We typically require rules to have a confidence above a certain threshold (e.g., 60% or 70%) to be considered strong.
C. Lift
Lift compares the observed co-occurrence of X and Y with what would be expected if they were statistically independent.
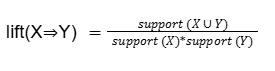
Lift(X⇒Y) = Confidence(X⇒Y) / Support(Y)
A lift of 1.0 means X and Y are independent. A lift greater than 1 indicates a positive association (X and Y occur together more often than chance).
For example, if support(X) = 0.4, support(Y) = 0.2 and support(X∪Y) = 0.12, then lift = 0.12/(0.4×0.2) = 1.5. This means X⇒Y is 1.5 times more likely than random.
Support, Confidence, and Lift: Quick Comparison
Here’s a quick comparison of support, confidence, and lift side by side:
| Support | Confidence | Lift | |
|---|---|---|---|
| Definition | Fraction of transactions containing the itemset | How often Y appears when X is present | How much more likely Y is bought with X compared to chance |
| Formula | Support(X) = (Transactions containing X) / (Total transactions) | Confidence(X⇒Y) = Support(X∪Y) / Support(X) | Lift(X⇒Y) = Confidence(X⇒Y) / Support(Y) |
| Range | 0 to 1 | 0 to 1 | 0 to infinity |
| Real-World Example | Out of 500 orders, 60 include a laptop, so support = 12% | Out of 60 laptop orders, 45 also include a mouse, so confidence = 75% | If support(laptop) = 0.12, support(mouse) = 0.15, support(laptop∪mouse) = 0.09, then lift = 5 |
| Ideal Threshold | Usually above 5% to 10% | Usually above 60% to 70% | Above 1 indicates a useful, positive association |
Association Rule Mining Algorithms
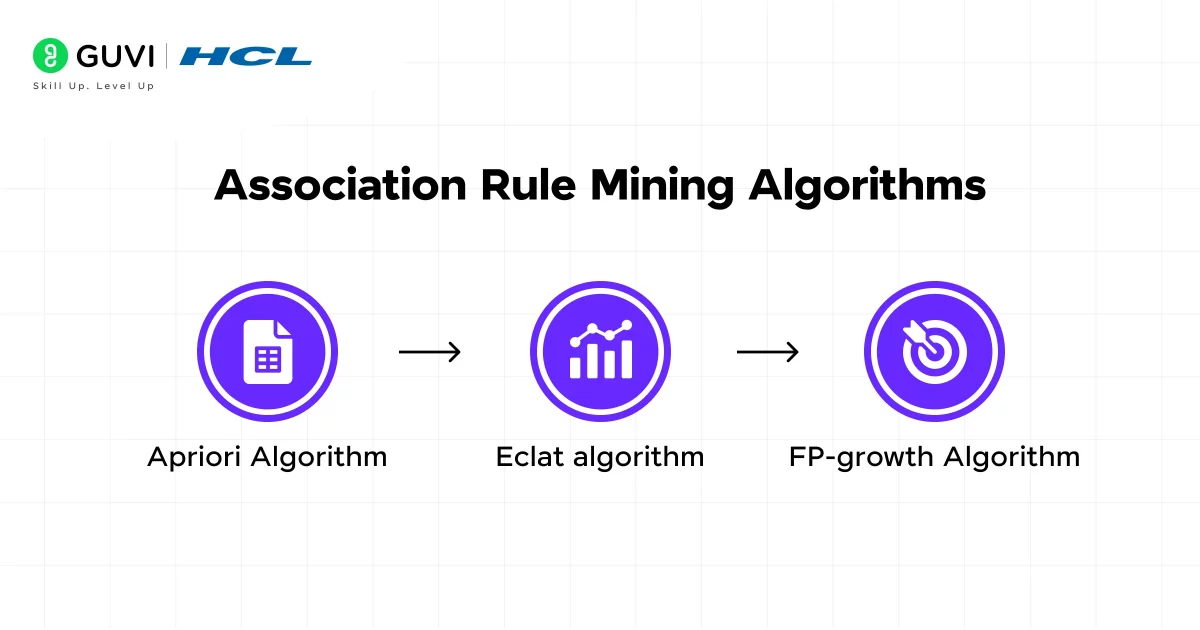
Finding association rules involves two main tasks: mining frequent itemsets and then generating rules from them. Two classic algorithms for this are Apriori and Eclat.
Apriori Algorithm
The Apriori algorithm is the most famous method for association rule mining. Apriori uses a bottom-up, breadth-first approach that relies on the “Apriori property”: if an itemset is frequent, then all of its subsets must also be frequent.
Conversely, if an itemset is infrequent (below min support), none of its supersets can be frequent. This property allows the algorithm to prune the search space aggressively.

The Apriori process works in iterations:
- Generate frequent 1-itemsets: Scan the dataset and count each item’s support. Keep only those items whose support meets the minimum threshold.
- Generate candidate 2-itemsets: Form all possible pairs from the frequent 1-itemsets, then scan the data to count their support. Discard any pair whose support is below the threshold.
- Iterate: Use the Apriori property to generate candidate 3-itemsets from the frequent 2-itemsets, prune infrequent candidates, and so on. Each iteration k generates frequent k-itemsets by combining frequent (k–1)-itemsets. The process stops when no new frequent itemsets can be found.
- Generate association rules: For each frequent itemset L and each non-empty subset X of L, form the rule X ⇒ (L–X) and compute its confidence. Keep rules whose confidence (and optionally lift) meets the given thresholds.
To put it simply, Apriori repeatedly scans the database: first to find frequent single items, then frequent pairs, triples, etc., pruning at each step using the Apriori property.
While simple and effective for moderate data, Apriori can become expensive on very large datasets because of many database passes and candidate generation.
Eclat Algorithm
Eclat (Equivalence Class Transformation) is an alternative frequent itemset mining algorithm. Unlike Apriori, which scans the database repeatedly in a horizontal layout, Eclat works in a vertical format.
In Eclat, each item is associated with a list of transaction IDs (TIDs) where it appears. The algorithm finds frequent itemsets by intersecting these TID lists. Key differences are:
- Apriori uses breadth-first search (BFS) on a horizontal dataset, repeatedly generating larger itemsets and scanning the whole database each time.
- Eclat uses depth-first search (DFS) on vertical representations, intersecting TID lists of smaller itemsets to quickly compute support of larger ones.
Because Eclat often requires fewer scans, it can be more memory-efficient and faster for large data. In practice, Eclat is a powerful alternative to Apriori when the dataset is large and can fit these TID lists in memory.
Applications of Association Rule in Data Science
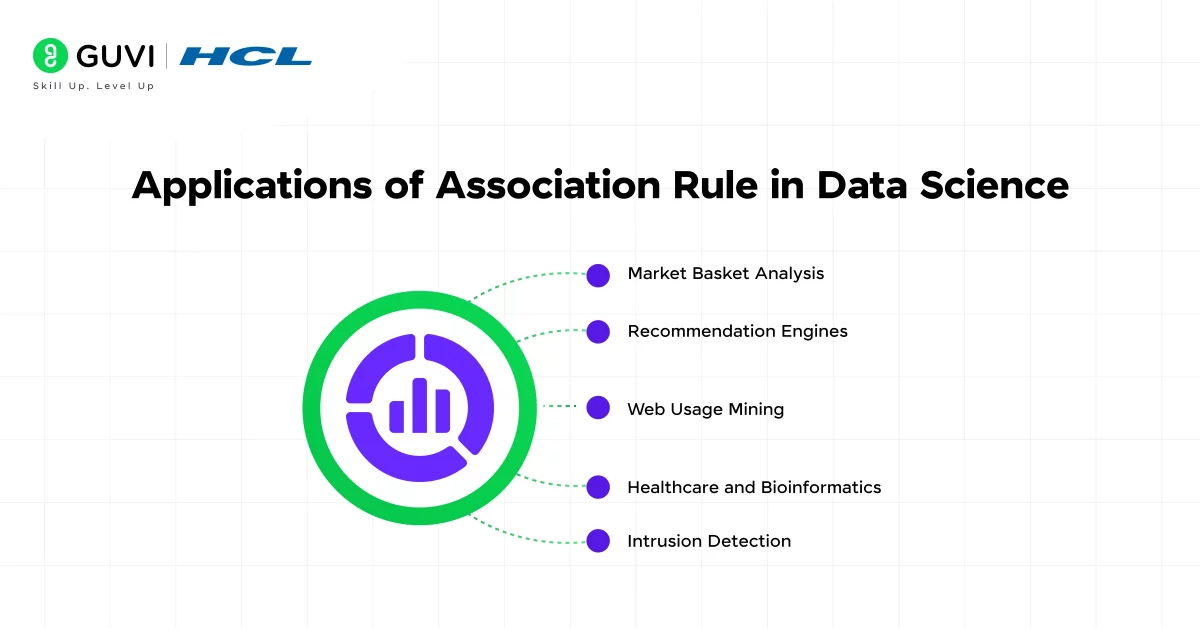
Association rule learning has many real-world applications, especially in retail and recommendation systems:
- Market Basket Analysis: Retailers analyze transaction data to see which products are often bought together. For example, supermarkets might discover that {Bread, Butter} ⇒ {Jam}. Such insights can drive promotions (e.g., bundle offers) and personalized recommendations.
- Recommendation Engines: E-commerce sites (like Amazon) use association rules to suggest items. For example, a shopper who adds “formal shoes” to the cart may see a recommendation, “customers who bought these shoes also bought socks.”
- Web Usage Mining: Association rules can find pages or links that are frequently visited together, helping to structure website navigation or target content.
- Healthcare and Bioinformatics: Rules can uncover associations between medical symptoms, diagnoses, or genetic markers. For example, an association rule might reveal that patients with symptoms X and Y often have disease Z.
- Intrusion Detection: In cybersecurity, association rules help detect patterns of system events that precede an attack, flagging unusual combinations of actions.
These applications all rely on the core idea: find patterns in data, then form human-readable rules that can guide decisions or actions. In business, domain experts must validate insights from association rules, but the method provides a powerful automated way to sift through large volumes of transactional data.
Interactive Challenge: Put Theory Into Practice
Test your understanding with this quick exercise:
- Question 1: In a dataset of 100 transactions, item A appears in 40 transactions, and items A and B appear together in 10 transactions. What is the support of {A} and the confidence of the rule {A}⇒{B}?
- Question 2: Suppose support({A}) = 0.4, support({B}) = 0.5, and support({A,B}) = 0.1. Compute the lift of the rule {A}⇒{B}. Is this a positive association or independence?
Try to answer before looking below.
Answers:
- Support({A}) = 40/100 = 0.40 (40%). Confidence({A}⇒{B}) = support({A,B}) / support({A}) = 10/40 = 0.25 (25%).
- Lift({A}⇒{B}) = support({A,B}) / (support({A})·support({B})) = 0.1 / (0.4·0.5) = 0.1 / 0.20 = 0.5. A lift of 0.5 (<1) indicates a negative association (A and B occur together less often than if they were independent).
Conclusion
In conclusion, association rules in data science are more than just a technique; they’re a foundational tool for understanding meaningful patterns in seemingly chaotic datasets. By understanding how items co-occur and evaluating their relationships through support, confidence, and lift, you can derive actionable insights that influence decision-making across industries.
As you move forward in your data science journey, mastering association rules will give you a strong edge in solving real-world problems with confidence.
FAQs
1. What is an association rule in data science?
It’s a technique that finds patterns showing how the presence of one item in data relates to another, like “if a customer buys X, they often buy Y too.”
2. What are the benefits of using association rules in data mining
They help businesses spot buying patterns, improve product placement, personalize recommendations, and catch fraud or anomalies faster.
3. What is the difference between support and confidence?
Support shows how often an itemset appears in the data, while confidence shows how often the rule actually holds true.
4. What algorithms are used for association rule mining?
Apriori and Eclat are the two most widely used algorithms for discovering association rules.
5. Where is association rule mining used in real life?
It’s common in retail for market basket analysis, in e-commerce for recommendations, and in finance for fraud detection.
Success Stories











Did you enjoy this article?