

Project Articles
Build No-Code AI Agents with Flowise AI: Step-by-Step Beginner Guide
How to Use Lovable AI With Demo Project

Get In Touch For Details! Request More Information
Data analytics is important in today’s data-rich world, offering insights and guiding decisions across industries. For those looking to get into this field, hands-on projects are key to transforming theoretical knowledge into practical expertise. This blog post explores a range of project ideas, suitable for beginners to advanced learners.
From analyzing user behavior and salary trends to getting into complex predictive models, these projects are designed to sharpen your analytics skills and enrich your portfolio. Let’s explore the exciting opportunities these data analytics projects present, setting the stage for a successful journey.
Table of contents
- What is Data Analytics?
- Top 30 Data Analytics Project Ideas
- A) Beginner-Level Data Analytics Projects
- B) Python Data Analytics Projects
- C) Rental and Housing Data Analytics Project Ideas
- D) Sports and NBA Data Analytics Projects
- E) Data Visualization Projects
- F) Music Analytics Projects
- G) Economic and Current Trends Analytics Projects
- H) Advanced Data Analytics Project
- Conclusion
- FAQs
- How do I pick a data analytics project that matches my skill level?
- What tools are essential for data analytics projects?
- Where can I find data for my analytics projects?
What is Data Analytics?
Data analytics refers to the process of examining, cleaning, transforming, and modeling data to discover useful information, draw conclusions, and support decision-making. It involves a series of steps that allow for the analysis and interpretation of the data to extract insights, identify trends, predict outcomes, and make data-driven decisions.
Data analytics is applied across various domains such as business intelligence, finance, healthcare, marketing, and more, using statistical algorithms and machine learning techniques to analyze and interpret complex datasets.
If you’re looking to enhance your skills in this field, consider enrolling in HCL GUVI’s Business Analyst Course. This course is designed to equip you with the knowledge and tools necessary for a successful career in data analytics.
Also Read: Data Science vs Data Analytics | Best Career Choice in 2025
At its core, data analytics encompasses several types:
- Descriptive Analytics: This focuses on summarizing and understanding historical data to identify patterns or trends.
- Diagnostic Analytics: It involves analyzing data to understand the reasons behind past successes or failures.
- Predictive Analytics: This uses statistical models and forecasting techniques to predict future outcomes based on historical data.
- Prescriptive Analytics: It goes beyond prediction to recommend actions you can take to affect desired outcomes.
Also Read: A Complete Guide on Data Science Syllabus | 2025
Now that we’ve explored the fundamentals of data analytics, let’s get into some practical data analytics project ideas.
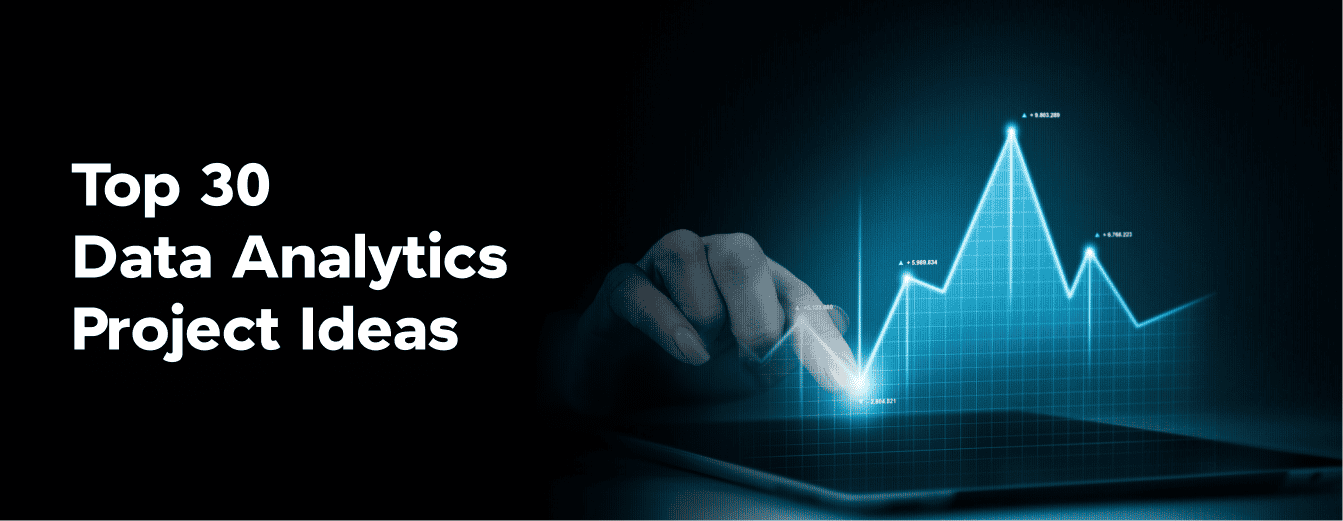
Top 30 Data Analytics Project Ideas
Data analytics projects are important for applying theoretical knowledge to real-world datasets, helping you gain practical experience, improve problem-solving skills, and understand data’s storytelling power.
Below is a comprehensive list of project ideas, categorized by complexity and thematic area, to inspire both beginners and seasoned analysts.
A) Beginner-Level Data Analytics Projects
Beginners can start with these projects to get comfortable with data manipulation, analysis, and basic visualization techniques.
1. Salary Analysis
This project aims to explore and understand the factors influencing salaries across various industries and roles. You can uncover insights into compensation trends and disparities by analyzing datasets containing salary information along with variables like education level, years of experience, job title, and location.
This project would involve cleaning the data, performing EDA to identify patterns and outliers, and using statistical tests to assess the impact of different factors on salaries.
Visualization tools could be employed to present findings in an accessible manner. This project not only sharpens data manipulation and analysis skills but also highlights the importance of transparency and equity in salary distributions.
Skills Required:
- Proficiency in data manipulation and cleaning techniques to prepare datasets for analysis.
- Strong understanding of exploratory data analysis (EDA) methods to uncover patterns and outliers in salary data.
- Knowledge of statistical testing to evaluate the impact of variables on salaries.
- Ability to create informative visualizations to present findings.
- Familiarity with data analysis tools and programming languages, such as Python or R.

2. Marketing Analytics Exploratory Data Analysis
This project analyzes marketing campaign data to uncover insights into customer behavior and campaign effectiveness. This project would involve examining various metrics such as campaign reach, engagement rates, conversion rates, and ROI across different channels (social media, email, PPC, etc.). You’d use EDA techniques to identify trends and patterns, and statistical analysis to evaluate the impact of different marketing strategies.
Visualization plays a key role here, with the creation of dashboards and reports to communicate findings to stakeholders. This project sharpens analytical skills and offers a deep learning of marketing analytics, preparing you for roles that intersect data analysis and marketing strategy.
Skills Required:
- Proficiency in data analysis and visualization tools (e.g., Python with pandas and matplotlib, R, Tableau).
- Understanding of marketing metrics (reach, engagement, conversion rates, ROI).
- Ability to conduct statistical analysis to evaluate marketing strategies.
- Strong communication skills for presenting findings to stakeholders.
- Knowledge of marketing channels (social media, email, PPC) and their analytics.
Also Read: The Role of Data Analytics in Recruitment: 8 Key Factors to Succeed!

3. UFO Sightings Data Analysis
This project offers a unique opportunity to explore a dataset filled with reports of unidentified flying objects. This intriguing dataset includes details such as the date and time of sightings, locations, descriptions of the objects, and the duration of each sighting. Your task would be cleaning the data, categorizing sightings, and performing temporal and spatial analysis to identify patterns or trends.
You might also apply text analysis techniques to the descriptions to categorize the sightings further. This project is perfect for practicing data cleaning, visualization, and temporal-spatial analysis while engaging with a dataset that is both fun and challenging.
Skills Required:
- Data Cleaning: Ability to preprocess and clean data to ensure accuracy and completeness.
- Categorization: Skills in categorizing data based on various attributes to facilitate analysis.
- Temporal Analysis: Understanding of how to analyze data over time to identify trends and patterns.
- Spatial Analysis: Knowledge of geographic data analysis to examine the distribution of sightings.
- Text Analysis: Skills in processing and categorizing textual descriptions using natural language processing (NLP) techniques.
- Data Visualization: Proficiency in creating visual representations of data to highlight key insights.
- Critical Thinking: Ability to interpret data, recognize patterns, and draw meaningful conclusions.

4. Data Cleaning Practice
Data cleaning is a fundamental step in the data analysis process, and this project is designed to hone these essential skills. You’d start with a dataset known for its quality issues, such as missing values, duplicates, inconsistencies, and outliers. Through a series of tasks, you’d apply various data cleaning techniques using tools like Pandas in Python or dplyr in R.
The project might include normalizing text data, handling missing data intelligently, detecting and removing duplicates, and identifying and correcting outliers. This project is important for anyone looking to strengthen their data preprocessing skills, which are applicable in virtually all data analysis projects.
Skills Required:
- Proficiency in Python or R for data manipulation.
- Understanding of Pandas (Python) or dplyr (R) for dataset operations.
- Knowledge of techniques for handling missing data, including imputation and deletion.
- Ability to normalize text data and standardize formats.
- Skills in detecting and removing duplicate records.
- Competence in identifying and correcting outliers through statistical methods.
Must Find Out Top 10 Reasons Why Python is Super Popular in 2025


B) Python Data Analytics Projects
For those familiar with Python, these projects will help sharpen your data manipulation, analysis, and visualization skills using Python libraries.
5. Wedding Crunchers
In this project, you’ll get into a dataset containing information about weddings, such as dates, locations, sizes, and costs. Your goal is to analyze trends and patterns that could provide insights into the most popular times of year for weddings, average costs, and preferred locations. You could also investigate how wedding trends have evolved.
This project involves data cleaning, temporal analysis, and the use of visualization tools to communicate your findings effectively. It’s a great way to practice handling real-world data while exploring an engaging and relatable topic.
Skills Required:
- Data cleaning and preprocessing
- Temporal data analysis
- Statistical analysis to identify trends and patterns
- Geographic data handling for location analysis
- Use of data visualization tools (e.g., Matplotlib, Seaborn) for effective communication
- Interpretation and presentation of data insights
Also Explore: Useful Python Libraries & Tools for Data Science Beginners

6. Scraping Craigslist
This project involves using web scraping techniques to collect data from Craigslist listings, such as price, location, category, and description of items for sale. It’s a hands-on opportunity to learn how to automate data collection from websites using scraping tools like BeautifulSoup or Scrapy in Python.
After gathering the data, you would clean and organize it, then perform exploratory data analysis to uncover trends, such as which categories are most popular, price distributions, or geographical patterns in listings.
If you’re looking to enhance your data analysis skills further, consider enrolling in HCL GUVI’s Data Analysis with Pandas course. This course is designed to help you master data manipulation and analysis techniques that are important for projects like these.
This project not only enhances your web scraping and data cleaning skills but also provides insights into the second-hand market dynamics.
Skills Required:
- Proficiency in Python and libraries such as BeautifulSoup or Scrapy for web scraping.
- Understanding of HTML and CSS selectors to navigate and extract data from web pages.
- Skills in data cleaning and organization to prepare the scraped data for analysis.
- Knowledge of exploratory data analysis techniques to identify trends and patterns.
- Familiarity with pandas for data manipulation and analysis, beneficial for in-depth analysis projects.

7. Uber Trip Analysis
In this project, you’ll analyze Uber trip data to understand travel patterns, peak demand times, and factors affecting ride frequency and duration. This might include analyzing trip data by time of day, day of the week, weather conditions, and rider demographics. The project involves data cleaning, exploratory data analysis, and possibly even predictive modeling to forecast demand under different conditions.
Visualizing the data on maps using libraries like Leaflet or Plotly can also provide valuable spatial insights. This project is excellent for developing a deeper understanding of urban mobility and the sharing economy.
Skills Required:
- Data cleaning and preprocessing skills to handle and prepare large datasets for analysis.
- Proficiency in exploratory data analysis techniques to uncover patterns and insights from the data.
- Experience with statistical modeling and predictive analytics to forecast demand and identify influencing factors.
- Knowledge of Python and data visualization libraries like Matplotlib, Seaborn, Leaflet, or Plotly for effective data presentation and spatial analysis.
- Understanding of urban mobility concepts and the sharing economy to contextualize findings and implications.
Also Explore: Top 20 Python Applications in the Real World

8. Twitter Sentiment Analysis
This project focuses on collecting Twitter data related to a specific topic, event, or hashtag, and analyzing the sentiment of tweets to gauge public opinion. Using natural language processing (NLP) techniques and sentiment analysis libraries like NLTK or TextBlob in Python, you’ll classify tweets as positive, negative, or neutral.
This project not only introduces you to the basics of NLP and sentiment analysis but also offers insights into social media trends, public reactions to events, and the spread of information online.
Skills Required:
- Understanding of natural language processing (NLP) fundamentals.
- Proficiency in Python programming.
- Familiarity with sentiment analysis libraries like NLTK or TextBlob.
- Ability to collect data using Twitter’s API.
- Analytical skills to interpret data and identify trends.
- Knowledge of data visualization techniques for presenting findings.

9. Home Pricing Predictions
This project involves building a predictive model to estimate home prices based on a dataset with features like location, size, number of bedrooms, and amenities. Using machine learning techniques such as linear regression, decision trees, or random forests, you’ll train and validate your model to predict prices accurately.
This project is a great way to practice the entire data science process, from data cleaning and feature engineering to model selection and evaluation. It also provides practical experience in real estate market analysis.
Skills Required:
- Proficiency in programming languages such as Python or R for data analysis and model building.
- Understanding of basic machine learning concepts and algorithms (linear regression, decision trees, random forests).
- Ability to perform data cleaning and preprocessing.
- Skill in feature engineering to enhance model performance.
- Competence in model evaluation and validation techniques.
- Knowledge of real estate market fundamentals for insightful data interpretation.
Also Read: Data-Driven Marketing: Benefits and Challenges in 2025

C) Rental and Housing Data Analytics Project Ideas
These projects are perfect for exploring the real estate market, understanding pricing dynamics, and analyzing customer preferences.
10. Zillow Housing Prices
This project tasks you with analyzing Zillow’s real estate data to identify trends in housing prices across different regions and periods. You can gain insights into the real estate market’s dynamics by exploring factors that influence price fluctuations, such as location, property size, and market conditions.
This project involves significant data visualization to track price trends and could extend to predictive modeling to forecast future housing prices in various areas. It’s a valuable project for anyone interested in real estate analytics.
Skills Required:
- Data Analysis: Proficiency in analyzing large datasets to identify trends and patterns.
- Data Visualization: Ability to create clear, insightful visual representations of data.
- Predictive Modeling: Skills in building models to forecast future trends.
- Statistical Analysis: Understanding statistical methods to interpret data accurately.
- Programming: Knowledge of programming languages like Python, especially libraries like Pandas and Matplotlib, for data manipulation and visualization.
- Real Estate Market Knowledge: Familiarity with factors that influence real estate prices.

11. Inside Airbnb
Inside Airbnb offers a closer look at Airbnb’s publicly available data on listings, reviews, and host information. This project involves analyzing the data to understand how listings vary by city, what factors contribute to pricing, and how guest reviews impact rental popularity. You’ll practice data cleaning, exploratory analysis, and possibly sentiment analysis on review texts.
This project is great for exploring the impact of the sharing economy on urban housing markets and hospitality trends.
Skills Required:
- Data cleaning and preprocessing to ensure the quality and usability of Airbnb datasets.
- Exploratory data analysis (EDA) techniques to identify patterns, trends, and outliers in the data.
- Basic understanding of statistical methods to analyze data distributions and relationships.
- Sentiment analysis on review texts to gauge customer satisfaction and its effects on popularity.
- Data visualization skills to effectively communicate findings through charts and graphs.
- Knowledge of the sharing economy’s impact on urban housing and hospitality trends.

12. Car Rentals
This project focuses on analyzing data from car rental companies to understand customer behavior, pricing strategies, and operational efficiency. By examining datasets containing details such as rental durations, types of cars rented, pickup and drop-off locations, and pricing, you can identify trends in consumer preferences and seasonal variations in demand.
Advanced analysis might explore the optimization of fleet management or the impact of promotional strategies on rental volumes. This project offers practical experience in data cleaning, time-series analysis, and the application of statistical models to drive business decisions.
Skills Required:
- Proficiency in data analysis tools (e.g., Python, R)
- Knowledge of time-series analysis
- Understanding of statistical modeling and machine learning basics
- Data cleaning and preprocessing
- Ability to interpret and visualize data insights
- Strategic thinking for business decision-making

13. Analyzing NYC Property Sales
This project involves working with the NYC property sales dataset, a rich source of information on real estate transactions across New York City. The goal is to analyze trends in property sales prices, volume, and other characteristics over time and by borough. You’d use data visualization techniques to map out geographical trends and use regression analysis to understand the factors influencing property values.
This project not only enhances your skills in handling geospatial data and applying econometric models but also provides insights into one of the world’s most dynamic real estate markets.
Skills Required:
- Proficiency in data analysis and manipulation tools (e.g., Python, R, SQL)
- Understanding of econometric and regression analysis techniques
- Ability to work with geospatial data and mapping tools (e.g., QGIS, ArcGIS)
- Skills in data visualization and interpretation
- Knowledge of real estate market fundamentals

D) Sports and NBA Data Analytics Projects
Sports enthusiasts can use these projects to analyze game data, player performance, and team dynamics.
14. NBA Data Analytics Project
In this project, you get into basketball statistics to analyze player performance, team efficiency, and game outcomes. Using data from sources like the NBA API, you could examine player stats across various metrics (e.g., points per game, rebounds, assists), evaluate team strategies, and predict match results. Techniques like clustering could identify player types, while predictive modeling might forecast season outcomes or player awards.
This project is an excellent way to combine a passion for sports with data analytics, offering skills in data visualization, statistical analysis, and predictive modeling.
Skills Required:
- Proficiency in data analysis and statistical software (e.g., Python, R).
- Understanding of data visualization tools for a clear representation of findings (e.g., Tableau, Matplotlib).
- Knowledge of machine learning techniques for predictive modeling and clustering.
- Familiarity with sports analytics and basketball statistics.
- Ability to interpret complex datasets and draw actionable insights.

15. Olympic Medals Analysis
This project examines historical Olympic Games data to uncover trends in medal wins across countries, sports, and time. You could explore questions such as which countries dominate certain sports, how home advantage affects medal counts, or how participation and success have evolved.
This project offers a chance to practice data manipulation, visualization, and the application of statistical tests to understand competitive dynamics and national sporting prowess on a global stage.
Skills Required:
- Proficiency in data manipulation and analysis tools (e.g., Python, R)
- Ability to create and interpret data visualizations
- Understanding of statistical tests and their applications
- Knowledge of historical and cultural contexts affecting sports
- Aptitude for identifying and exploring trends in large datasets

16. Soccer Power Rankings
This project aims to create a power ranking system for soccer teams based on historical match data, including wins, losses, goals scored, and goals conceded. By applying ranking algorithms or machine learning models, you’d generate dynamic rankings that reflect the current form and strength of teams. The analysis could extend to examining the impact of home advantage or key players on team performance.
This project is perfect for those interested in sports analytics, teaching skills in data modeling, algorithmic thinking, and predictive analytics.
Skills Required:
- Proficiency in data analysis and manipulation
- Understanding of statistical models and machine learning algorithms
- Knowledge of soccer and sports analytics
- Ability to work with large datasets
- Familiarity with programming languages like Python or R for data analysis
- Critical thinking for algorithmic development
- Skills in predictive analytics and pattern recognition

17. Home Field Advantage Analysis
This project investigates the phenomenon of home-field advantage across different sports by analyzing game outcomes, scores, and team performance when playing at home versus away. Statistical analysis can quantify the size of the home advantage and explore factors contributing to it, such as crowd support, familiarity with the venue, or travel fatigue for the away team.
This project offers valuable insights into sports psychology and logistics, honing your ability to conduct hypothesis testing and regression analysis.
Skills Required:
- Statistical Analysis: Proficiency in applying statistical methods to compare performance metrics.
- Data Collection & Management: Ability to gather and organize game outcome and performance data.
- Hypothesis Testing: Skills in formulating and testing hypotheses regarding home-field advantage.
- Regression Analysis: Experience in using regression models to identify factors influencing home-field advantage.
- Sports Psychology & Logistics Understanding: Knowledge of sports psychology and logistics to interpret findings.
- Critical Thinking: Capacity for analytical thinking and problem-solving.

18. Daily Fantasy Sports
In this project, you would build models to predict player performances in sports leagues, using these predictions to inform fantasy team selections. By analyzing player statistics, team dynamics, and matchup variables, you can identify undervalued players and optimal team compositions for fantasy contests. This project blends data science with the strategy of fantasy sports, requiring skills in predictive modeling, optimization, and decision analysis under uncertainty.
Skills Required:
- Predictive Modeling: Building and refining models to forecast player performances based on historical data and current trends.
- Data Analysis: Analyzing player statistics, team dynamics, and game conditions to extract actionable insights.
- Optimization: Utilizing mathematical and computational methods to determine the optimal fantasy team composition.
- Decision Analysis: Assessing risks and rewards to make informed decisions under uncertainty.
- Programming: Proficiency in programming languages like Python or R for data manipulation and model development.
Also Read: How Long Would It Take to Learn Data Science?

E) Data Visualization Projects
These projects focus on the visual representation of data, helping to communicate complex information clearly and effectively.
19. Visualizing Pollution
In this project, you’re tasked with creating compelling visualizations of pollution data, potentially covering air quality, water pollution, or noise levels across different geographic locations and over time. Utilizing datasets from environmental monitoring agencies or public data sources, you’d use mapping tools and data visualization libraries to highlight pollution hotspots, trends, and the impact of policy changes or events on environmental quality.
This project emphasizes the power of data visualization in conveying complex environmental data to a wide audience, promoting awareness and informed public discourse on environmental issues.
Skills Required:
- Proficiency in data visualization tools (e.g., Tableau, Power BI) or libraries (e.g., D3.js, matplotlib)
- Understanding of GIS and mapping tools (e.g., QGIS, ArcGIS)
- Ability to analyze and interpret environmental data
- Knowledge of data cleaning and preprocessing
- Skills in storytelling and visual communication

20. Visualizing Top Movies
This project involves analyzing datasets from movie databases like IMDb or Rotten Tomatoes to create visualizations that explore trends in movie ratings, genres, box office performance, and critical reception over time. You could examine the relationship between a film’s budget and its success, trends in genre popularity, or the impact of awards on a movie’s rating and financial success.
This project teaches data manipulation and visualization skills, offering insights into the film industry and the factors that contribute to a movie’s success.
Skills Required:
- Data Analysis: Ability to analyze and interpret complex datasets to identify trends and insights.
- Data Visualization: Proficiency in creating clear, compelling visualizations to represent data trends and relationships.
- Programming: Knowledge of programming languages like Python, especially libraries like Pandas for data manipulation and matplotlib or seaborn for visualization.
- Critical Thinking: Ability to critically evaluate data and draw meaningful conclusions about movie industry trends.
- Research: Skills in gathering additional data and context to enrich analysis and findings.

21. Gender Pay Gap Analysis
This project aims to explore the differences in compensation between genders across various industries and roles. Using salary survey data, you would conduct statistical analysis to identify disparities and explore factors that might explain these differences, such as industry, job level, education, and experience. Visualization tools would help communicate the findings, highlighting areas where the gender pay gap is most pronounced and tracking progress over time.
This project not only sharpens analytical and visualization skills but also contributes to important discussions around equity in the workplace.
Skills Required:
- Proficiency in statistical analysis and data science methodologies
- Experience with data visualization tools (e.g., Tableau, Power BI, Matplotlib)
- Understanding of econometric models to analyze wage disparities
- Ability to clean and preprocess large datasets
- Knowledge of labor economics and workplace equity principles
Also Read: Roles and Responsibilities of a Data Scientist

22. Visualize Your Favorite Book
This unique project invites you to create visualizations based on the themes, characters, or plot structure of your favorite book. Using text analysis techniques, you could map the interactions between characters, visualize the sentiment of different chapters, or track the frequency of key themes throughout the text. This project encourages creativity and the application of data visualization techniques to literature, offering a novel way to engage with and interpret written works.
Skills Required:
- Proficiency in text analysis and natural language processing (NLP) to interpret and analyze the book’s content.
- Data visualization skills to create meaningful and insightful representations of the analysis.
- Creativity in linking literary themes and concepts to visual elements.
- Basic programming knowledge, particularly in languages and libraries suited for text analysis and data visualization (e.g., Python, R, matplotlib, seaborn, D3.js).

F) Music Analytics Projects
Music lovers can get into these projects to analyze trends, popularity, and evolution within the music industry.
23. Popular Music Analysis
This project examines trends in popular music by analyzing datasets from music charts, streaming services, or social media mentions. You could explore changes in genre popularity, the characteristics of hit songs, or the impact of social media on music success. Techniques such as time-series analysis, sentiment analysis, and network analysis could be applied.
This project is perfect for combining a passion for music with data analytics, offering insights into the dynamics of the music industry.
Skills Required:
- Data Collection: Ability to gather data from music charts, streaming platforms, and social media.
- Data Analysis: Proficiency in time-series analysis, sentiment analysis, and network analysis.
- Statistical Tools: Familiarity with tools like Python, R, or MATLAB for data analysis.
- Music Industry Knowledge: Understanding of music genres, trends, and industry dynamics.
- Critical Thinking: Ability to interpret data and draw insights on music trends.

24. KPOP Melon Music Charts Analysis
Focusing specifically on the Korean pop music scene, this project involves analyzing data from the Melon Music Charts to understand trends, popularity, and the impact of social phenomena on KPOP. You could examine the rise and fall of different KPOP groups, the global spread of KPOP, or the relationship between online engagement and chart success.
This project allows for the exploration of cultural dynamics through the lens of data analytics, utilizing time-series analysis, social media analysis, and predictive modeling.
Skills Required:
- Data Analysis: Proficiency in analyzing large datasets to uncover trends and patterns.
- Time-Series Analysis: Understanding of time-series data to analyze chart performance over time.
- Social Media Analysis: Ability to analyze social media metrics to gauge popularity and engagement.
- Predictive Modeling: Skills in creating models to predict future trends based on historical data.
- Statistical Analysis: Knowledge of statistical tools and methods for accurate data interpretation.
- Programming: Proficiency in programming languages like Python or R, particularly in libraries for data analysis (e.g., pandas, NumPy, sci-kit-learn).
- Data Visualization: Ability to create compelling visualizations to present findings effectively.
- Cultural Understanding: Insight into cultural trends and phenomena, specifically within the KPOP industry.

G) Economic and Current Trends Analytics Projects
These projects are ideal for those interested in economic indicators, news trends, and global datasets.
25. News Media Dataset
This project tasks you with analyzing datasets from various news outlets to uncover trends in media coverage, sentiment, and public interest. Using natural language processing to analyze article contents and metadata, you could explore biases in coverage, the impact of major events on media focus, or the relationship between news sentiment and public opinion.
This project enhances skills in text analysis, sentiment analysis, and data visualization, providing insights into the role of media in shaping public discourse.
Skills Required:
- Proficiency in natural language processing (NLP) techniques to analyze text data
- Ability to perform sentiment analysis to gauge the tone and mood of media coverage
- Data visualization skills for presenting findings effectively
- Understanding of media ethics and bias identification
- Knowledge of data collection and preprocessing methods for large datasets

26. The Big Mac Index Analytics
The Big Mac Index is a creative measure introduced by The Economist as an informal way of measuring the purchasing power parity (PPP) between two currencies. By analyzing the price of a Big Mac across different countries, you can explore concepts of currency valuation, cost of living, and economic disparity. This project involves collecting Big Mac prices from various countries, adjusting for exchange rates, and comparing them to actual currency values to identify over- or undervalued currencies.
Advanced analysis might correlate Big Mac prices with other economic indicators like GDP per capita or inflation rates. This project offers practical experience in economic data analysis, currency markets, and the visualization of complex financial concepts.
Skills Required:
- Data Collection: Gathering current Big Mac prices and exchange rates from various countries.
- Economic Analysis: Understanding purchasing power parity (PPP) and currency valuation.
- Statistical Analysis: Applying statistical methods to compare and contrast economic indicators.
- Data Visualization: Creating graphs and charts to present complex financial data.
- Critical Thinking: Analyzing and interpreting data to draw meaningful conclusions about currency valuation and economic health.

27. Global Country Information Dataset
This project involves analyzing a comprehensive dataset that includes various metrics and indicators for countries around the world, such as GDP, population, health statistics, education levels, and more. The goal is to identify patterns, correlations, and trends among different countries and regions. You might explore questions like how economic development relates to health outcomes, or how education levels impact economic growth.
This project teaches you how to handle and analyze large datasets, use statistical methods to draw insights, and effectively visualize data to communicate your findings. It’s particularly valuable for those interested in global development, economics, and policy analysis.
Skills Required:
- Proficiency in data analysis tools (e.g., Python, R)
- Understanding of statistical methods and data science techniques
- Ability to work with large datasets and perform data cleaning and preprocessing
- Skills in data visualization and presentation
- Knowledge of global development, economics, and policy analysis

28. College Rankings and Tuition Costs Dataset
In this project, you’ll analyze data related to college rankings, tuition costs, and possibly other factors such as student-to-faculty ratios, graduation rates, and post-graduation earnings. The aim is to uncover insights into the higher education landscape, evaluate the relationship between cost and quality, and identify trends in tuition increases.
You could also investigate the impact of college rankings on tuition prices or explore the return on investment (ROI) for different colleges and majors. This project hones skills in data cleaning, exploratory data analysis, and regression modeling, and is particularly relevant for those interested in education economics and policy.
Skills Required:
- Data Cleaning: Ability to preprocess datasets to handle missing values, outliers, and inconsistencies.
- Exploratory Data Analysis (EDA): Skills in using statistical and visualization techniques to understand data trends and patterns.
- Regression Modeling: Proficiency in applying regression analysis to explore relationships between variables.
- Critical Thinking: Capacity to interpret data insights and evaluate the impact of education economics and policy.
- Communication: Skills in presenting complex data insights in an understandable way to non-technical audiences.

H) Advanced Data Analytics Project
For those ready to tackle more complex data challenges, these projects involve advanced analytical techniques and predictive modeling.
29. Analyzing Google Trends Data
This project uses data from Google Trends to analyze interest in various topics over time and across different regions. You could explore trends related to technology adoption, political events, health epidemics, or consumer behavior. The challenge involves correlating search interest with real-world events, understanding seasonal patterns, and predicting future trends based on past data.
This project is an excellent way to practice working with time-series data, performing correlation analysis, and developing predictive models. It offers insights into public interest and behavior, making it valuable for market researchers, journalists, and policymakers.
Skills Required:
- Data collection and preprocessing: Extracting and cleaning data from Google Trends.
- Time-series analysis: Understanding and analyzing data over time.
- Correlation analysis: Identifying relationships between search trends and real-world events.
- Predictive modeling: Using statistical or machine learning models to forecast future trends.
- Data visualization: Creating graphs and charts to represent trends and patterns.

30. New York Times (NYT) Movie Reviews Sentiment Analysis
In this project, you’ll perform sentiment analysis on movie reviews from The New York Times to gauge the overall sentiment towards movies and correlate these sentiments with box office performance, awards, and viewer ratings. Using natural language processing (NLP) techniques, you’ll classify reviews into positive, negative, or neutral categories, and analyze the relationship between review sentiment, publication timing, and a movie’s commercial success.
This project not only improves your NLP and machine learning skills but also provides insights into the impact of media on entertainment and culture.
Skills Required:
- Natural Language Processing (NLP): Understanding of text processing and sentiment analysis techniques.
- Machine Learning: Familiarity with classification algorithms and model evaluation methods.
- Data Analysis: Ability to interpret results and identify patterns in data.
- Python Programming: Proficiency in Python and libraries like pandas, NumPy, sci-kit-learn, and NLTK or spaCy.
- Data Visualization: Skills in visualizing data insights using libraries such as Matplotlib or Seaborn.

These project ideas span a wide range of interests and skill levels, offering something for everyone looking to learn data analytics. By tackling these projects, you’ll not only develop valuable analytics skills but also gain insights that could inform real-world decisions and strategies.
Conclusion
We encourage readers to get into these projects, starting with those that match their current skill level and gradually tackling more complex challenges. Through this journey, you’ll not only enhance your data analytics skills but also gain confidence in your ability to make data-driven decisions and insights. The road to data analytics mastery is paved with practice, curiosity, and continuous learning—hands-on projects are your stepping stones.
Also Explore: Business Analytics vs Data Analytics: Which is More Important in 2025?
FAQs
How do I pick a data analytics project that matches my skill level?
Evaluate your skills in programming, statistical analysis, and data handling.
1) Beginners should start with basic data cleaning and visualization projects.
2) Intermediate learners can tackle machine learning models and complex analyses.
3) Advanced users can explore predictive modeling and in-depth domain-specific projects.
What tools are essential for data analytics projects?
You’ll need programming languages like Python or R, equipped with libraries for data manipulation, visualization, and machine learning.
Familiarity with SQL for database management, tools like Tableau or Power BI for advanced visualizations, and an IDE such as Jupyter Notebooks or RStudio are also valuable.
Where can I find data for my analytics projects?
Explore public datasets on platforms like Kaggle or the UCI Machine Learning Repository, utilize APIs from various services for real-time data, or use web scraping tools to collect your datasets from websites.
You can also use personal or work-related data, ensuring privacy and ethical guidelines are followed.
Success Stories


Did you enjoy this article?