


Data Science Articles
Accountant vs Data Analyst Salary in India After Switching Careers - Best Guide
Finance Managers: Could Data Science Be Your Next Career Move?
Insurance Claims Executive to Data Analyst: Is It a Good Switch?
Banking Executive (Loans, KYC) to Data Analyst: Skills and Career Path


Get In Touch For Details! Request More Information

Exploratory Data Analysis (EDA) in Data Science: Checklist, Steps and Common Mistakes
Oct 09, 2026 4 Min Read 32483 Views
(Last Updated)
Exploratory Data Analysis (EDA) is the process of examining a dataset using statistics and visuals before you build any model. It helps you spot missing values, outliers, and relationships between variables so your machine learning model isn’t built on shaky data.
Here’s what EDA in data science typically involves:
- Checking data structure with
df.info()anddf.describe() - Finding and handling missing values
- Visualizing distributions with histograms and box plots
- Spotting correlations with a heatmap
- Detecting outliers before modeling
- Studying relationships between variables (bivariate and multivariate analysis)
Table of contents
- TL;DR Summary
- Why Exploratory Data Analysis Still Matters in 2026?
- EDA Checklist: 10 Steps Before Every ML Project
- EDA Walkthrough Using the Titanic Dataset
- Step 1: Load and inspect the data
- Step 2: Summary statistics with df.describe()
- Step 3: Check missing data
- Step 4: Visualize distributions with plt.hist()
- Step 5: Correlation heatmap with sns.heatmap()
- Step 6: Bivariate check
- Common EDA Mistakes Data Scientists Make
- Conclusion
- FAQs
- What is Exploratory Data Analysis in data science?
- Which Python libraries are used for Exploratory Data Analysis?
- Is Exploratory Data Analysis necessary before every machine learning project?
- What is the difference between EDA and data cleaning?
- Which dataset is best for practicing EDA as a beginner?
- How long does it take to learn Exploratory Data Analysis?
TL;DR Summary
- This blog covers Exploratory Data Analysis (EDA) and how it helps you understand data before building a machine learning model.
- It guides you through a 10-step EDA checklist, including missing values, duplicates, distributions, outliers, and correlations.
- It also explores EDA using the Titanic dataset with practical Python steps and visualizations.
- It helps you avoid common EDA mistakes, like ignoring outliers, missing values, and class imbalance.
- It also explains why Exploratory Data Analysis (EDA) is important before every machine learning project.
Why Exploratory Data Analysis Still Matters in 2026?
Most data science tutorials jump straight to model building. That’s a mistake.
A model trained on unexamined data will quietly learn from missing values, duplicate rows, and outliers you never caught. Exploratory Data Analysis (EDA) is where you catch these problems while they’re still cheap to fix.
Ready to take your EDA skills beyond the Titanic dataset? Join HCL GUVI’s Advanced Data Science & Generative AI Course and learn Python, machine learning, deep learning, and Generative AI through live online classes, 10+ real-world projects, and 1:1 doubt sessions. Earn an IITM Pravartak certification, prepare with mock interviews and placement assistance, and start from scratch with no prior coding experience needed. Enroll today and build a career in data science!
EDA Checklist: 10 Steps Before Every ML Project
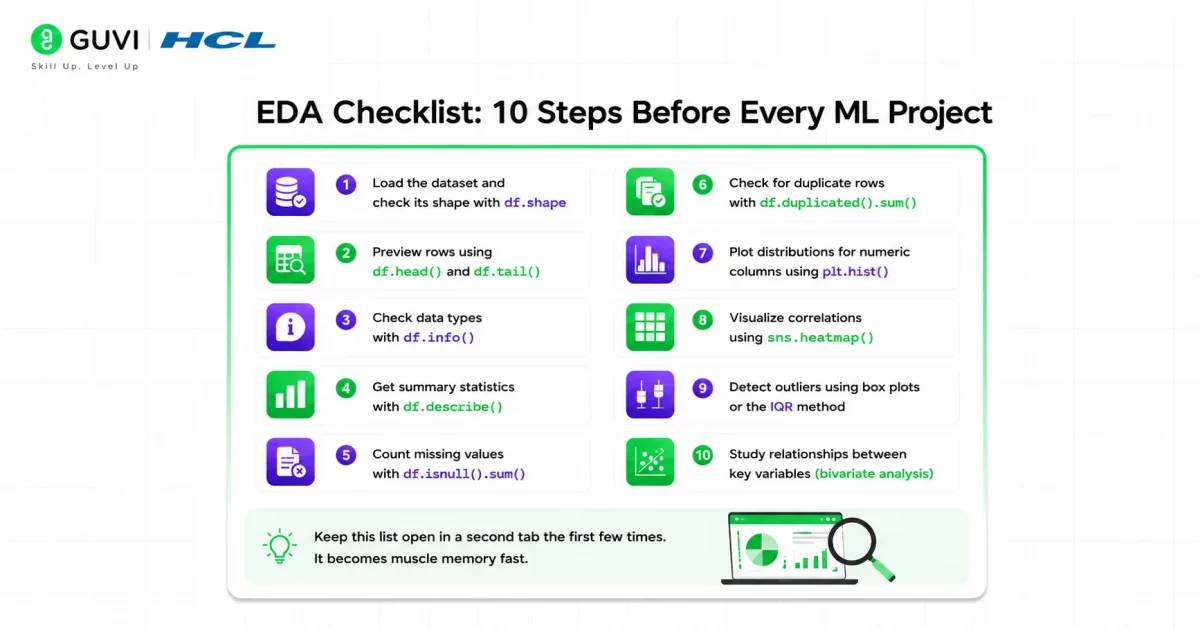
Run through this before you touch a single model:
- Load the dataset and check its shape with
df.shape: tells you how many rows and columns you have, so you know if the dataset is big enough to model. - Preview rows using
df.head()anddf.tail(): catches obvious problems early, like wrong headers, odd values or messy formatting. - Check data types with
df.info(): shows columns stored as the wrong type, like dates or numbers saved as text. - Get summary statistics with
df.describe()anddf['col'].value_counts():describe()shows the mean, spread and min/max of numeric columns, whilevalue_counts()checks categorical columns for class imbalance. - Count missing values with
df.isnull().sum(): shows which columns need imputing or dropping. - Check for duplicate rows with
df.duplicated().sum(): duplicates can inflate accuracy and leak data between train and test sets. - Plot distributions for numeric columns using
plt.hist(): shows whether columns are skewed, which decides if they need transforming. - Detect outliers using box plots or the IQR method: extreme values can distort the mean, correlations and the model itself.
- Visualize correlations using
sns.heatmap(): shows which features move together and which relate most to the target. - Study relationships between key variables (bivariate analysis): confirms whether a feature really affects the target.
Keep this list open in a second tab the first few times. It becomes muscle memory fast.
Data scientists spend close to 80% of their project time on data preparation and exploration, not on building the actual model, according to widely cited industry surveys on data science workflows.
EDA Walkthrough Using the Titanic Dataset
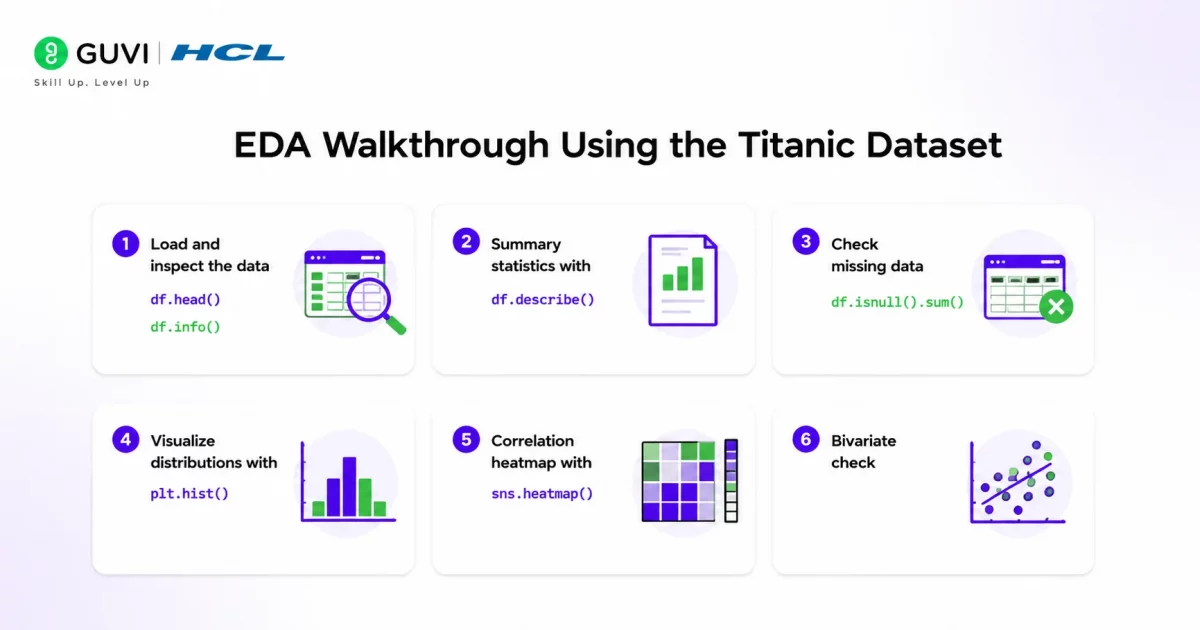
Theory only takes you so far. Here’s Exploratory Data Analysis applied to the Titanic dataset, a common beginner dataset for classification problems.
Step 1: Load and inspect the data
python
import pandas as pd

df = pd.read_csv('titanic.csv')
df.head()
df.info()
This tells you column names, data types, and how many non-null values each column has.
Code Explanation:
import pandas as pdloads pandas, the library used to handle table-like data.pd.read_csv('titanic.csv')reads the CSV file into a DataFrame calleddf.df.head()shows the first 5 rows so you can see what the data looks like.df.info()lists every column with its data type and non-null count.
Step 2: Summary statistics with df.describe()
python
df.describe()For the Titanic dataset, this instantly shows you that the average passenger age is around 29 to 30, fares are heavily right-skewed, and Age has missing values that need handling.
Code Explanation:
df.describe() gives the count, mean, standard deviation, min, quartiles and max for every numeric column.
Step 3: Check missing data
python
df.isnull().sum()The Age and Cabin columns usually show the most missing values in this dataset. This decides whether you impute, drop, or flag them as a separate category.
Code Explanation:
df.isnull()marks each cell asTrueif the value is missing..sum()adds up thoseTruevalues, giving the missing count for each column.
Step 4: Visualize distributions with plt.hist()
python
import matplotlib.pyplot as plt

df['Fare'].hist(bins=30)
plt.title('Fare Distribution')
plt.xlabel('Fare')
plt.ylabel('Passengers')
plt.show()
This shows most passengers paid low fares, with a long tail of expensive first-class tickets, a classic sign you’ll need to handle skew before modeling.
Code Explanation:
import matplotlib.pyplot as pltloads the plotting library (imported once and reused in later steps).df['Fare'].hist(bins=30)draws a histogram of theFarecolumn, split into 30 equal-width ranges called bins.plt.title(),plt.xlabel()andplt.ylabel()add the chart title and the axis labels.plt.show()displays the chart.
Read More: Data Visualization in Data Science

Step 5: Correlation heatmap with sns.heatmap()
python
import seaborn as sns

sns.heatmap(df.corr(numeric_only=True), annot=True, cmap='coolwarm')
plt.title('Correlation Heatmap')
plt.show()
On Titanic, this usually reveals that Pclass and Fare are moderately correlated with Survived, which is a strong early signal for feature selection.
Code Explanation:
import seaborn as snsloads seaborn, a chart library built on matplotlib.df.corr(numeric_only=True)calculates the correlation between every pair of numeric columns and skips text columns.sns.heatmap()draws that correlation table as a colored grid.annot=Trueprints the correlation value inside each cell.cmap='coolwarm'sets the colors: warm shades for positive and cool shades for negative correlation.plt.title()adds the title andplt.show()displays the chart.
Step 6: Bivariate check
python
sns.boxplot(x='Survived', y='Age', data=df)
plt.show()
A quick box plot like this can reveal whether age had any real relationship with survival, or whether it’s mostly noise.
If you’re working with a housing price dataset instead, the exact same six steps apply. Swap Survived for SalePrice, and the heatmap step becomes even more important since housing data usually has many correlated numeric features.
Code Explanation:
sns.boxplot(x='Survived', y='Age', data=df)draws one box of ages for eachSurvivedvalue (0 = did not survive, 1 = survived).data=dftells seaborn where the columns come from.- Each box shows the median and the middle 50% of ages, and dots beyond the whiskers are outliers.
plt.show()displays the plot.
Great models start with great data. HCL GUVI’s Data Science & Analytics Certification Course teaches you Exploratory Data Analysis (EDA), data gathering, and cleaning, then moves into supervised and unsupervised machine learning and model interpretation with LIME and SHAP. Beginner-friendly, with recorded lessons and a certificate upon completion. Start learning today!
Common EDA Mistakes Data Scientists Make
- Skipping the missing value check: Jumping straight to visualization without running
df.isnull().sum()first often leads to silently biased charts and models. - Ignoring outliers: A handful of extreme values can distort your mean, correlation, and even your model’s decision boundary. Always look before you decide to keep or remove them.
- Reading
df.describe()only for numeric columns: Categorical columns need their own check withdf['col'].value_counts(). Skipping this hides class imbalance problems. - Treating EDA as a one-time step: New features, joins, or cleaned versions of the data all deserve a fresh round of EDA. Don’t assume your first pass still applies.
- Overplotting without a question: Making twenty charts without asking what you’re checking for wastes time. Every plot should answer something specific.
Also Read: Best Datasets for Data Science Projects
Conclusion
Exploratory Data Analysis is not a box to tick before modeling, it’s the step that decides whether your model is trustworthy. Running through df.describe(), missing value checks, histograms, and a correlation heatmap on every new dataset takes minutes but saves hours of debugging later.
Start applying this checklist on a Kaggle dataset like Titanic or Housing Prices, and it will quickly become second nature.
FAQs
1. What is Exploratory Data Analysis in data science?
EDA, or Exploratory Data Analysis, is the process of examining a dataset using statistics and visualizations to understand its structure, quality, and patterns before building a model.
2. Which Python libraries are used for Exploratory Data Analysis?
Pandas for data handling, Matplotlib and Seaborn for visualization, and NumPy for numerical operations are the most commonly used libraries for EDA.
3. Is Exploratory Data Analysis necessary before every machine learning project?
Yes. Skipping EDA often means models are trained on missing values, outliers, or unbalanced classes that go unnoticed until the model underperforms in production.
4. What is the difference between EDA and data cleaning?
Data cleaning fixes issues like missing values and duplicates. EDA is a broader process of exploring the data and often uncovers issues that data cleaning then fixes.
5. Which dataset is best for practicing EDA as a beginner?
The Titanic dataset and the Boston or Ames Housing dataset are common for beginners because they’re small, well documented, and include a mix of numeric and categorical features.
6. How long does it take to learn Exploratory Data Analysis?
With consistent practice on two or three real datasets, most beginners get comfortable with core EDA steps like df.describe(), histograms, and correlation heatmaps within two to three weeks.
Success Stories














Did you enjoy this article?