

Data Science Articles
CA to Data Scientist: Skills, Roadmap and Career Path
Data Analytics vs Data Science for Finance Professionals: Which Path Fits?
Can a Senior Accountant With 2–3 Years of Experience Switch to Data Analytics?

Get In Touch For Details! Request More Information
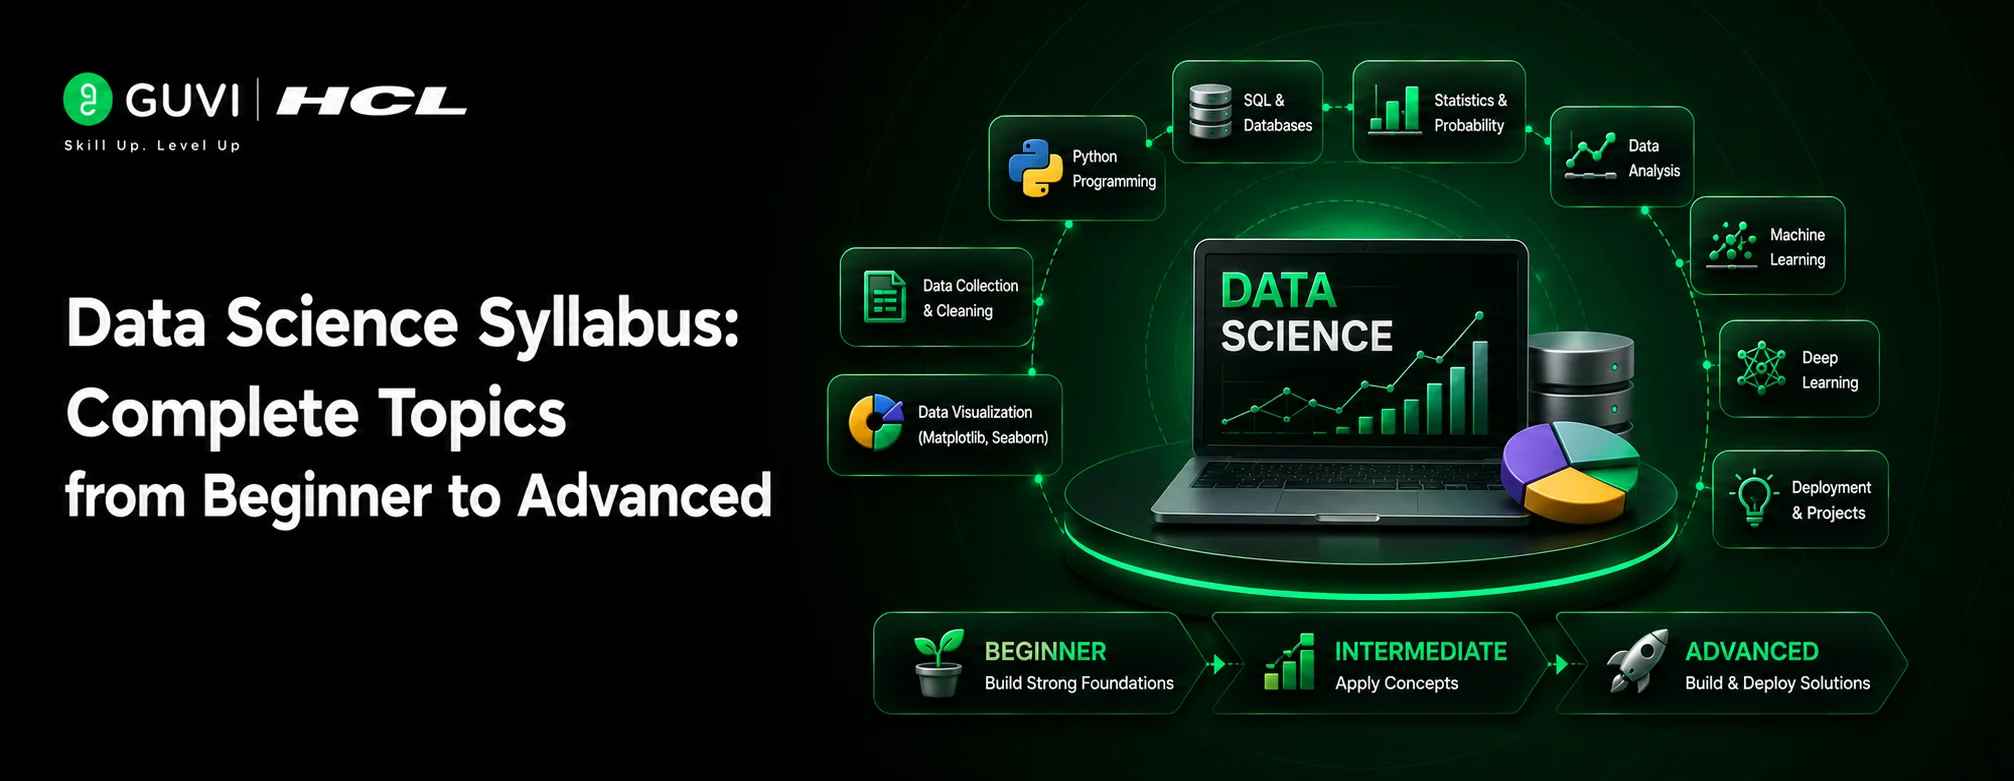
Data Science Syllabus 2026: Complete Topics from Beginner to Advanced
Oct 09, 2026 8 Min Read 20418 Views
(Last Updated)
Most people who decide to learn data science open ten tabs, bookmark five courses, and still don’t know where to start. The problem is rarely motivation. Usually, nobody has told them what to learn first, what can wait, or how long each step realistically takes.
A clear Data Science Syllabus fixes that. This blog lays out topics from beginner to advanced, with how long each one takes and the tools you will use, so you can plan your learning instead of guessing.
Quick Answer:
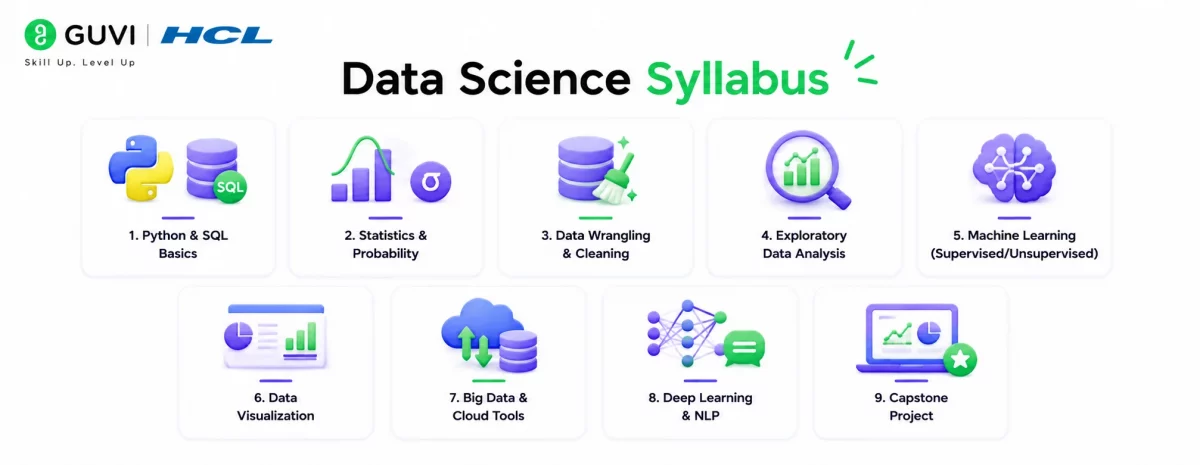
A Data Science Syllabus covers 9 core topics: Python and SQL, statistics and probability, data wrangling, exploratory data analysis, machine learning, data visualization, big data and cloud tools, deep learning and NLP, and a capstone project. Studied one after another at a part-time pace, the full syllabus takes roughly 10 to 14 months, moving from beginner to advanced.
Table of contents
- Data Science Syllabus 2026: Topics by Stage
- Data Science Syllabus 2026: Module-Wise Breakdown
- Module 1: Python & SQL Basics
- Module 2: Statistics & Probability
- Module 3: Data Wrangling & Cleaning
- Module 4: Exploratory Data Analysis
- Module 5: Machine Learning (Supervised/Unsupervised)
- Module 6: Data Visualization
- Module 7: Big Data & Cloud Tools
- Module 8: Deep Learning & NLP
- Module 9: Capstone Project
- Data Science Syllabus at IIT vs Private Universities vs Online Courses
- Which Data Science Topics Are Used on the Job vs Never Used?
- Data Science Syllabus for Non-Math Students: Simplified Version
- Common Mistakes When Following a Data Science Syllabus
- Conclusion
- FAQs
Data Science Syllabus 2026: Topics by Stage
Here is a quick view of what you will study, when, and with which tools.
| Topic | Stage | Time Required | Tools |
|---|---|---|---|
| Python & SQL basics | Beginner | 4 to 8 weeks | Python, MySQL |
| Statistics & Probability | Beginner | 4 to 8 weeks | Excel, Python |
| Data Wrangling & Cleaning | Beginner to Intermediate | 2 to 3 weeks | Pandas, NumPy |
| Exploratory Data Analysis | Intermediate | 2 to 3 weeks | Matplotlib, Seaborn |
| Machine Learning (Supervised/Unsupervised) | Intermediate | 8 to 12 weeks | Scikit-learn |
| Data Visualization | Intermediate | 4 to 6 weeks | Tableau, Power BI |
| Big Data & Cloud Tools | Advanced | 6 weeks | Hadoop, Spark, AWS |
| Deep Learning & NLP | Advanced | 10 to 12 weeks | TensorFlow, PyTorch |
| Capstone Project | Advanced | 3 to 4 weeks | Full stack of the above |
Ready to turn your interest in data into a career? HCL GUVI’s Advanced Data Science & Generative AI Course takes you from scratch to job-ready in 6 months, with live online classes, 1:1 doubt sessions, and 10+ real-world projects. Learn in English, Hindi, Telugu, or Tamil, earn an IITM Pravartak certification, and get placement support with mock interviews and 1000+ hiring partners. No coding background needed. Enroll today and start building your future!
In 1974, Danish computer scientist Peter Naur used the term “data science” in his book Concise Survey of Computer Methods, long before it became a popular career.
Data Science Syllabus 2026: Module-Wise Breakdown
The Data Science Syllabus is organized into 9 modules, starting with Python and SQL basics and ending with a capstone project. Each module below lists the key topics it covers:
Module 1: Python & SQL Basics
Every data science journey starts with two skills: telling a computer what to do, and asking a database the right questions. Python handles the first, SQL handles the second. This module gets you comfortable with both before anything complicated shows up.
Key Topics Covered
- Python Fundamentals: Variables, data types, loops, and conditions that form the base of every script.
- Functions and Data Structures: Lists, dictionaries, tuples, and reusable functions to keep code clean.
- File Handling: Reading and writing CSV and text files.
- SQL Queries: Using SELECT, WHERE, ORDER BY, and GROUP BY to pull the data you need.
- Joins and Aggregations: Combining tables and summarizing data with functions like COUNT and SUM.
Tools Used
- Python: The main language for data analysis and machine learning.
- MySQL: A widely used database system for practicing SQL queries.
Duration: 4 to 8 weeks
Outcome
- Write basic Python programs on your own.
- Retrieve data from databases using SQL.
- Combine multiple tables with joins.
- Be ready to move on to statistics and data cleaning.
Module 2: Statistics & Probability
Numbers on their own say very little. Statistics gives you the habit of asking whether a pattern is real or just luck, and probability gives you a way to measure how sure you can be. Most of the later modules lean on these ideas, so this is where you build the reasoning behind the code.
Key Topics Covered
- Descriptive Statistics: Mean, median, mode, variance, and standard deviation to summarize a dataset quickly.
- Probability Basics: Events, conditional probability, and Bayes’ theorem for reasoning about uncertainty.
- Distributions: Normal, binomial, and Poisson distributions and where each one shows up in real data.
- Sampling and Estimation: How a small sample can represent a larger population, and what confidence intervals tell you.
- Hypothesis Testing: T-tests, chi-square tests, and p-values for checking whether a result is meaningful.
- Correlation and Regression Basics: Measuring how two variables move together and drawing a simple trend line.
Tools Used
- Excel: Good for quick calculations, summary statistics, and basic charts.
- Python: Libraries like NumPy and SciPy handle statistical tests and simulations.
Duration: 4 to 8 weeks
Outcome
- Summarize and describe any dataset with the right measures.
- Choose a suitable statistical test for a given problem.
- Read p-values and confidence intervals correctly.
- Understand the math behind machine learning models later on.
Module 3: Data Wrangling & Cleaning
Real datasets are rarely tidy. They come with blank cells, repeated rows, odd date formats, and typos that quietly break your results. This module is about turning that mess into something reliable, and it is where a lot of working data scientists spend a big share of their time.
Key Topics Covered
- Handling Missing Values: Deciding when to drop, fill, or flag gaps in the data.
- Removing Duplicates and Errors: Spotting repeated records, wrong entries, and inconsistent labels.
- Data Type Conversion: Fixing dates, numbers, and text stored in the wrong format.
- Outlier Detection: Finding extreme values and deciding whether they are mistakes or real signals.
- Merging and Reshaping Data: Combining datasets and changing their layout using joins, pivots, and groupby.
- String Cleaning: Standardizing names, categories, and text fields.
Tools Used
- Pandas: The go-to Python library for loading, cleaning, and transforming tabular data.
- NumPy: Handles fast numerical operations and array-based calculations.
Duration: 2 to 3 weeks
Outcome
- Turn a raw, messy file into an analysis-ready dataset.
- Handle missing values and outliers with a clear reason behind each choice.
- Merge data from multiple sources without losing accuracy.
- Build a repeatable cleaning process you can reuse on new data.
Module 4: Exploratory Data Analysis
Before building any model, you need to know what your data is actually saying. Exploratory Data Analysis is the stage where you poke around, plot things, and let the dataset show you its patterns, quirks, and surprises. A few hours spent here can save you from weeks of building on a wrong assumption.
Key Topics Covered
- Summary Statistics: Quick checks on the spread, center, and shape of each column.
- Univariate Analysis: Studying one variable at a time using histograms, box plots, and count plots.
- Bivariate and Multivariate Analysis: Looking at how two or more variables relate to each other.
- Correlation Analysis: Using correlation matrices and heatmaps to spot strongly related features.
- Pattern and Trend Discovery: Finding seasonality, clusters, and unusual behavior in the data.
- Forming Hypotheses: Turning what you observe into questions worth testing.
Tools Used
- Matplotlib: Gives you full control over building charts from scratch in Python.
- Seaborn: Built on top of Matplotlib, it makes statistical plots faster and cleaner to create.
Duration: 2 to 3 weeks
Outcome
- Understand the structure and quality of any new dataset quickly.
- Spot relationships and anomalies using the right charts.
- Decide which features are worth using in a model.
- Present early findings with clear, simple visuals.
Module 5: Machine Learning (Supervised/Unsupervised)
This is the module most people picture when they think of data science. Here, you stop describing the past and start teaching a system to predict what comes next or to find hidden groups on its own.
You will learn how models are trained, how to tell whether they are any good, and how to avoid fooling yourself with results that look better than they really are.
Key Topics Covered
- Regression Models: Predicting numbers, such as prices or sales, using linear and polynomial regression.
- Classification Models: Predicting categories using logistic regression, decision trees, random forests, and support vector machines.
- Clustering: Grouping similar data points without labels using K-Means and hierarchical clustering.
- Dimensionality Reduction: Reducing the number of features with PCA while keeping the important information.
- Model Evaluation: Measuring performance with accuracy, precision, recall, F1-score, and RMSE.
- Overfitting and Cross-Validation: Ensuring a model works on new data, not just the data it learned from.
- Hyperparameter Tuning: Adjusting model settings to get better results.
Tools Used
- Scikit-learn: A Python library that provides ready-to-use algorithms, along with tools for training, testing, and tuning models.
Duration: 8 to 12 weeks
Outcome
- Build and train both supervised and unsupervised models.
- Pick the right algorithm for a given problem.
- Evaluate a model honestly using proper metrics.
- Recognize and fix overfitting before it becomes a problem.
Module 6: Data Visualization
A good analysis loses its value if nobody understands it. This module is about turning findings into dashboards and reports that managers, clients, and teammates can read in seconds.
It is less about making charts look pretty and more about choosing the right visual for the point you want to make.
Key Topics Covered
- Choosing the Right Chart: Matching bar charts, line charts, scatter plots, and maps to the kind of data you have.
- Dashboard Design: Arranging visuals so the main message is clear at a glance.
- Interactive Filters and Slicers: Letting users explore the data themselves.
- Calculated Fields and Measures: Creating custom metrics using Tableau calculations and DAX in Power BI.
- Connecting Data Sources: Pulling in data from Excel files, databases, and other sources.
- Data Storytelling: Structuring visuals so they lead the viewer to a clear conclusion.
Tools Used
- Tableau: A popular tool for building interactive dashboards with drag-and-drop controls.
- Power BI: Microsoft’s business analytics tool, widely used in companies that already use Excel and other Microsoft products.
Duration: 4 to 6 weeks
Outcome
- Build clean, interactive dashboards from raw data.
- Choose visuals that make a point instead of confusing the viewer.
- Share insights in a form that non-technical people can follow.
- Connect and refresh data from different sources.
Module 7: Big Data & Cloud Tools
Everything so far works well when the data fits on your laptop. Once a dataset grows to millions or billions of rows, a single machine starts to struggle, and that is where distributed systems and cloud platforms come in.
This module introduces how large-scale data is stored, processed, and moved around in real companies.
Key Topics Covered
- Distributed Storage: How HDFS splits large files across many machines so they can be stored and read in parallel.
- MapReduce Concepts: The basic idea of breaking a big job into smaller tasks and combining the results.
- Apache Spark and PySpark: Processing large datasets quickly in memory, using DataFrames and SQL-style queries.
- Cloud Storage and Compute: Using AWS services such as S3 for storage and EC2 for running workloads.
- Data Pipelines: Moving data from source to destination in a reliable, repeatable way.
- Cost and Scale Awareness: Understanding how cloud usage is billed and how to avoid wasting resources.
Tools Used

- Hadoop: An open-source framework for storing and processing very large datasets across clusters.
- Spark: A fast processing engine that handles big data jobs, and is more commonly used than Hadoop’s MapReduce today.
- AWS: Amazon’s cloud platform, used for storage, computing, and managed data services.
Duration: Approx. 6 weeks
Outcome
- Explain how big data systems differ from single-machine workflows.
- Process large datasets using PySpark.
- Store and access data on a cloud platform like AWS.
- Understand how data pipelines are built in production.
Module 8: Deep Learning & NLP
Some problems, like recognizing a face in a photo or understanding a sentence, are too tangled for traditional models.
Deep learning uses layered neural networks to handle exactly these cases, and Natural Language Processing applies those ideas to text.
It is the most demanding module in the syllabus, but it also powers many of the AI products people use every day.
Key Topics Covered
- Neural Network Basics: Neurons, layers, activation functions, and how a network learns through backpropagation.
- Training Deep Networks: Loss functions, optimizers, batch sizes, and techniques like dropout to reduce overfitting.
- Convolutional Neural Networks: Models designed for image-related tasks.
- Sequence Models: RNNs and LSTMs for ordered data, such as text and time series.
- Text Preprocessing: Tokenization, stop-word removal, stemming, and lemmatization.
- Word Embeddings and Transformers: How words become numbers, and how transformer models power modern language tasks.
- NLP Applications: Sentiment analysis, text classification, and basic chatbots.
Tools Used
- TensorFlow: Google’s framework for building and deploying neural networks, often used with its Keras interface.
- PyTorch: A flexible framework popular in research and increasingly in production work.
Duration: 10 to 12 weeks
Outcome
- Build and train a basic neural network from scratch.
- Apply deep learning to image or text problems.
- Clean and prepare text data for NLP tasks.
- Understand the core idea behind transformer-based language models.
Module 9: Capstone Project
This is where everything you have learned comes together. Instead of practicing one skill at a time, you take a real problem from start to finish: collecting the data, cleaning it, exploring it, building a model, and presenting the result.
A strong capstone is often the first thing a recruiter looks at, so choose a problem you can explain with confidence.
Key Topics Covered
- Problem Definition: Picking a clear business or real-world question worth solving.
- Data Collection: Gathering data from public datasets, APIs, or databases.
- Cleaning and Exploration: Applying wrangling and EDA to understand and prepare the data.
- Model Building and Evaluation: Training suitable models and comparing their results honestly.
- Visualization and Reporting: Presenting findings through dashboards or a written summary.
- Documentation and Portfolio: Publishing your code and explanations on GitHub so others can review your work.
Tools Used
- Python and SQL: For data handling, analysis, and modeling.
- Machine Learning and Visualization Tools: Scikit-learn, Tableau or Power BI, and any deep learning or cloud tools the project needs.
Duration: 3 to 4 weeks
Outcome
- Complete a full data science project from raw data to final insight.
- Show a clear, end-to-end workflow in your portfolio.
- Explain your choices and results to technical and non-technical people.
- Be ready to discuss real project experience in interviews.
Data Science Syllabus at IIT vs Private Universities vs Online Courses
The core subjects barely change across formats. What changes is depth, pace, and how much hand-holding you get.
IIT and top public university programs lean heavily on theory first. You will spend real time on the mathematical proofs behind algorithms, not just how to call .fit() in scikit-learn. This suits you if you are aiming for research roles or a master’s degree later.
Private university degree programs sit in the middle. They cover the same subjects but move faster into tools and applications, with less emphasis on deriving formulas from scratch.
Online industry courses (like HCL GUVI, Coursera, or Scaler) focus on job readiness. The syllabus is sequenced around what recruiters test for: SQL, Python, ML basics, and a project portfolio. Math is taught only as far as you need it, not to prove it.
None of these paths is “better” in isolation. If you want a corporate data scientist role within a year, an online, project-heavy syllabus usually gets you there faster.
Which Data Science Topics Are Used on the Job vs Never Used?
This is where most syllabus guides go quiet, so let’s be direct about it.
Used constantly on the job:
- SQL, for pulling and joining data
- Python with Pandas, for cleaning and transforming
- Basic statistics, for explaining results to stakeholders
- Data visualization, for reporting
- Supervised ML algorithms like regression and classification
Used occasionally, depending on the role:
- Deep learning, mostly if you work in computer vision or NLP-heavy teams
- Big data tools like Spark, mostly at companies with genuinely large datasets
- A/B testing frameworks, common in product and growth teams
Rarely touched after the course:
- Manually deriving gradient descent equations
- Writing MapReduce jobs from scratch
- Advanced linear algebra proofs
You still need to learn these to build intuition. But once you are on the job, tools abstract most of the math away. Interviews and daily work test SQL, Python, and clear communication of results.
Explore: Data Science Webinars and Workshops
Data Science Syllabus for Non-Math Students: Simplified Version
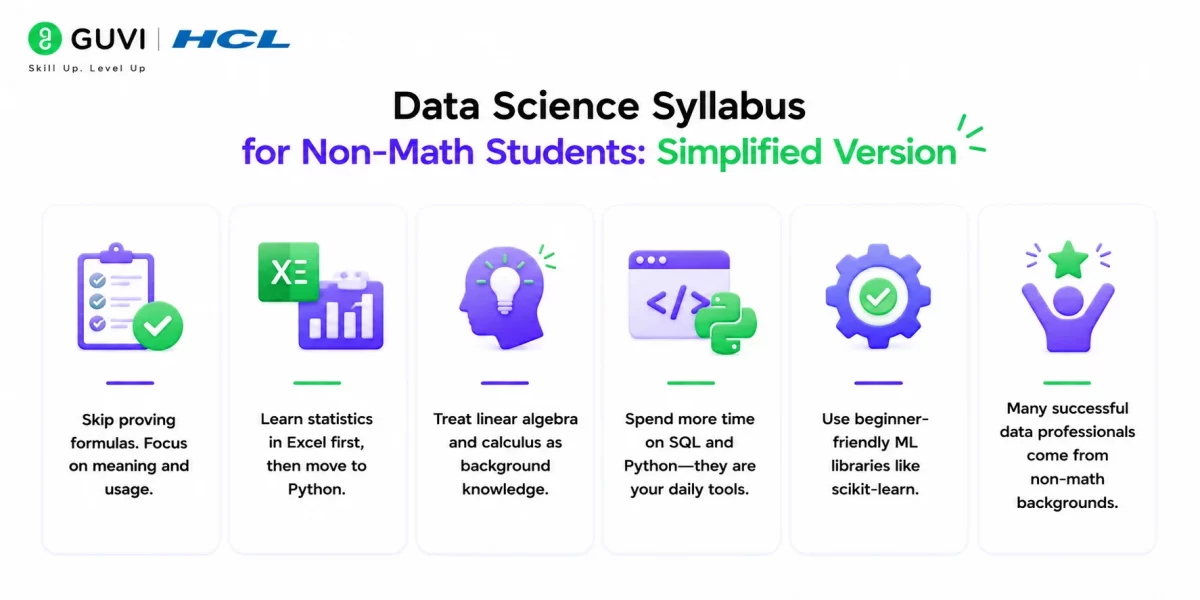
If your background is commerce, arts, or a non-engineering degree, you can still follow the same syllabus. You just approach the math differently.
- Skip proving formulas. Focus on what each statistical concept means and when to use it.
- Learn statistics through Excel first, then move to Python once the concepts feel familiar.
- Treat linear algebra and calculus as background knowledge, not something you need to solve by hand. Most beginner-friendly ML courses only expect you to understand the intuition.
- Spend extra time on SQL and Python. These two compensate for a lot of missing math confidence, since they are the tools you’ll use daily.
- Pick beginner-friendly ML libraries like scikit-learn, which handle the underlying math for you.
Plenty of working data analysts and data scientists come from non-math backgrounds. What matters more is comfort with logical thinking and consistent practice.
Common Mistakes When Following a Data Science Syllabus
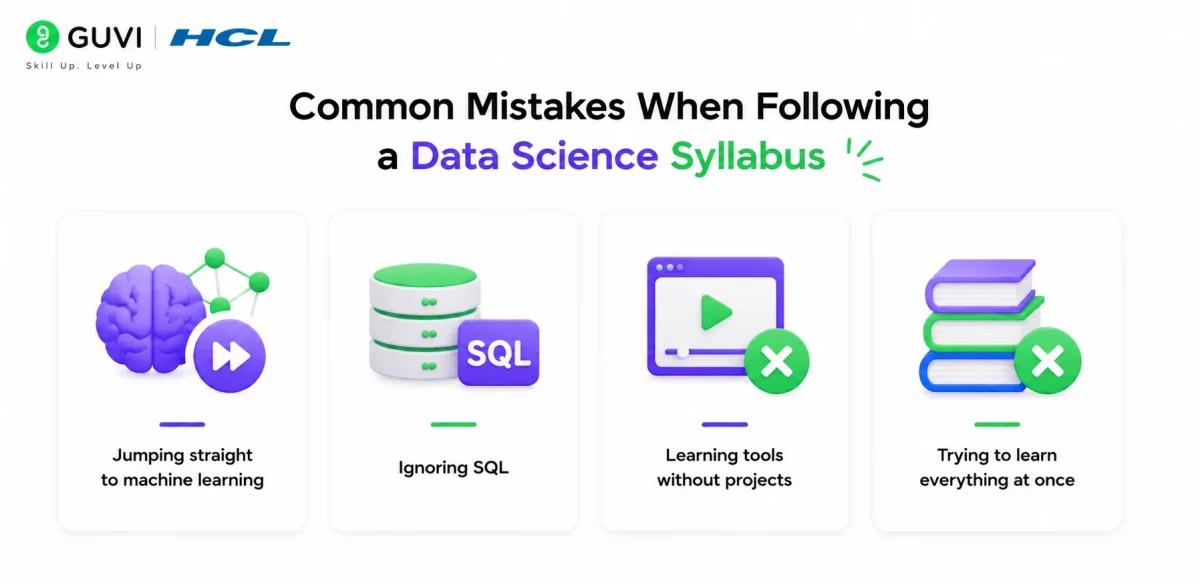
- Jumping straight to machine learning: Skipping statistics and data cleaning leads to models you don’t actually understand. Build the foundation first.
- Ignoring SQL: Many beginners focus only on Python and neglect SQL, which is asked in nearly every data role interview.
- Learning tools without projects: Watching tutorials without building anything leaves you with theoretical knowledge that doesn’t hold up in interviews.
- Trying to learn everything at once: Trying Python, R, big data, and deep learning at the same time usually leads to burnout. Sequence it.
Ready to turn your interest in data into a career? HCL GUVI’s Advanced Data Science & Generative AI Course takes you from scratch to job-ready in 6 months, with live online classes, 1:1 doubt sessions, and 10+ real-world projects. Learn in English, Hindi, Telugu, or Tamil, earn an IITM Pravartak certification, and get placement support with mock interviews and 1000+ hiring partners. No coding background needed. Enroll today and start building your future!
Conclusion
A Data Science Syllabus is only useful if you act on it, and the best time to start is before you feel ready. Pick the first module, set a weekly schedule you can actually stick to, and build something small along the way.
Progress in this field comes from consistent practice, not from finishing the list in record time, so move at a pace that keeps you learning without burning out.
FAQs
1. What is the data science syllabus for 2026?
It covers programming (Python, SQL), statistics, data wrangling, exploratory data analysis, machine learning, data visualization, and advanced topics like deep learning and big data tools.
2. Is math compulsory for the data science syllabus?
Basic statistics and probability are necessary, but you don’t need advanced math proofs to get job-ready. Tools handle most of the heavy computation.
3. How long does it take to complete a data science syllabus?
Most learners take 4 to 6 months for core topics and up to 10 months to become fully job-ready with projects.
4. What is the difference between a data science syllabus at a university and an online course?
Universities go deeper into theory and math. Online courses prioritize tools, projects, and job-readiness.
5. Which data science topics are most used in real jobs?
SQL, Python with Pandas, basic statistics, data visualization, and supervised machine learning are used most frequently.
6. Can non-math students follow a data science syllabus?
Yes. Focus on intuition over formal proofs, and lean on SQL and Python, which don’t require a heavy math background.
7. What tools are covered in a typical data science syllabus?
Python, SQL, Pandas, NumPy, Scikit-learn, Tableau or Power BI, and cloud tools like AWS for advanced stages. Data analytics focuses more on reports, dashboards, and business insights.
8. Do I need to learn deep learning as a beginner?
No. Deep learning is an advanced topic, useful mainly for computer vision and NLP roles. Beginners should focus on core ML first.
Success Stories








Did you enjoy this article?