


Artificial Intelligence and Machine Learning Articles
Finance Manager to Data Analytics: Career Growth, Salary and Seniority
How to Evaluate LLM Outputs in Production Deployments
AI/ML Skills Gap 2026: Why Companies Can't Find Job-Ready Talent
20 AI/ML Interview Questions Recruiters Can Use Without a Tech Background - Best Guide


Get In Touch For Details! Request More Information
What is Model Drift Detection: Keeping Models Accurate in Production
Sep 01, 2026 4 Min Read 423 Views
(Last Updated)
Model drift detection is the practice of monitoring deployed machine learning models to identify when their predictions become less accurate or reliable over time. Drift occurs when the statistical properties of the input data or the relationship between inputs and outputs change after deployment, causing a model trained on historical data to perform worse on new data. Detecting drift early allows teams to retrain, recalibrate, or replace models before users experience significant degradation in prediction quality.
Table of contents
- TL;DR Summary
- The Three Types of Drift
- Drift Types at a Glance
- Statistical Methods for Detecting Data Drift
- Drift Detection Method Reference
- Building a Drift Detection Pipeline
- Conclusion
- FAQs
- What is model drift detection?
- What are the three types of model drift?
- How do you detect data drift without ground truth labels?
- What is the Population Stability Index used for?
- Which tools are available for drift detection?
- How often should you run drift detection?
TL;DR Summary
- Model drift detection monitors production ML models for performance degradation caused by changes in input data or the relationship between inputs and outcomes
- There are three main types of drift: data drift (input distribution changes), concept drift (the relationship between inputs and outputs changes), and prediction drift (model output distribution shifts)
- Detecting drift requires comparing production data distributions and model performance metrics against a baseline established at deployment time
- Statistical tests including the Kolmogorov-Smirnov test, Population Stability Index, and Jensen-Shannon divergence are the most common tools for detecting data drift
The Three Types of Drift
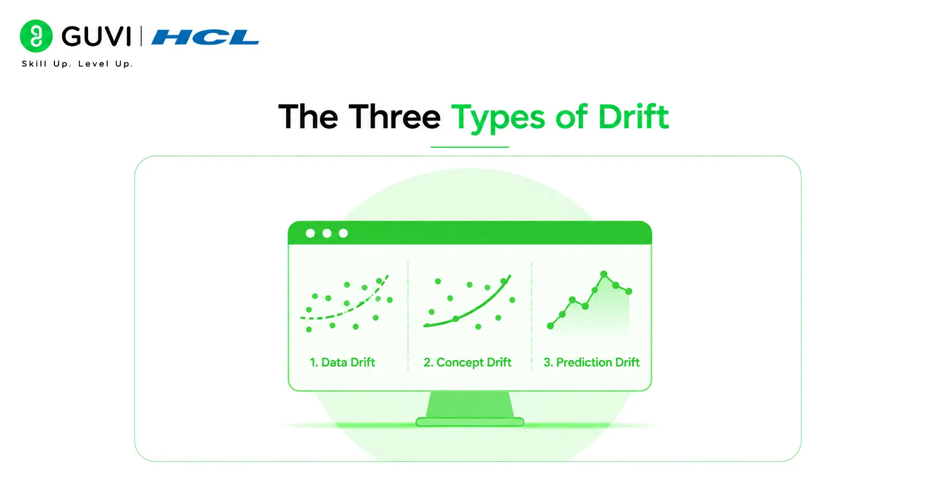
- Data Drift
Data drift, also called covariate shift, occurs when the statistical distribution of input features changes after deployment. The model’s learned mapping from inputs to outputs may still be correct, but because it is now receiving different inputs than it was trained on, predictions become unreliable.
Data drift can affect individual features or combinations of features. A feature that was normally distributed during training may become right-skewed in production. Two features that were highly correlated during training may decorrelate. A categorical feature may develop new category values that were absent from training data.
Data drift is the most detectable type of drift because it can be identified without any ground truth labels, just by comparing input distributions between training and production data.
- Concept Drift
Concept drift occurs when the underlying relationship between inputs and outputs changes. Even if the input distribution remains stable, the correct output for a given input is now different from what the model learned.
A sentiment analysis model trained on product reviews may develop concept drift if the vocabulary of sentiment expression changes over time. A price prediction model may experience concept drift during unusual economic conditions where historical input-output relationships break down.
Concept drift is harder to detect because it requires observing actual outcomes, not just inputs. You need ground truth labels from production to measure it directly.
- Prediction Drift
Prediction drift occurs when the distribution of the model’s output predictions shifts, even if individual predictions may still be correct. If a binary classifier that previously predicted class 1 for 30 percent of inputs suddenly predicts class 1 for 60 percent of inputs, something has changed.
Prediction drift can be detected without ground truth and often serves as an early warning signal of data drift or concept drift upstream. Monitoring output distribution is a lightweight first line of defense.
Want to build production MLOps skills covering model monitoring, drift detection, and automated retraining pipelines? Explore HCL GUVI’s Artificial Intelligence & Machine Learning Course, designed to help you develop the practical ML engineering foundations that real production AI roles demand.
Drift Types at a Glance
| Drift Type | What Changes | Detectable Without Labels | Primary Cause |
| Data Drift | Input feature distributions | Yes | External changes to data sources |
| Concept Drift | Input-to-output relationship | No, requires ground truth | World changes, new patterns |
| Prediction Drift | Model output distribution | Yes | Data drift or concept drift upstream |
| Label Drift | Output label distribution | Only with delayed labels | Changes in ground truth prevalence |
Statistical Methods for Detecting Data Drift
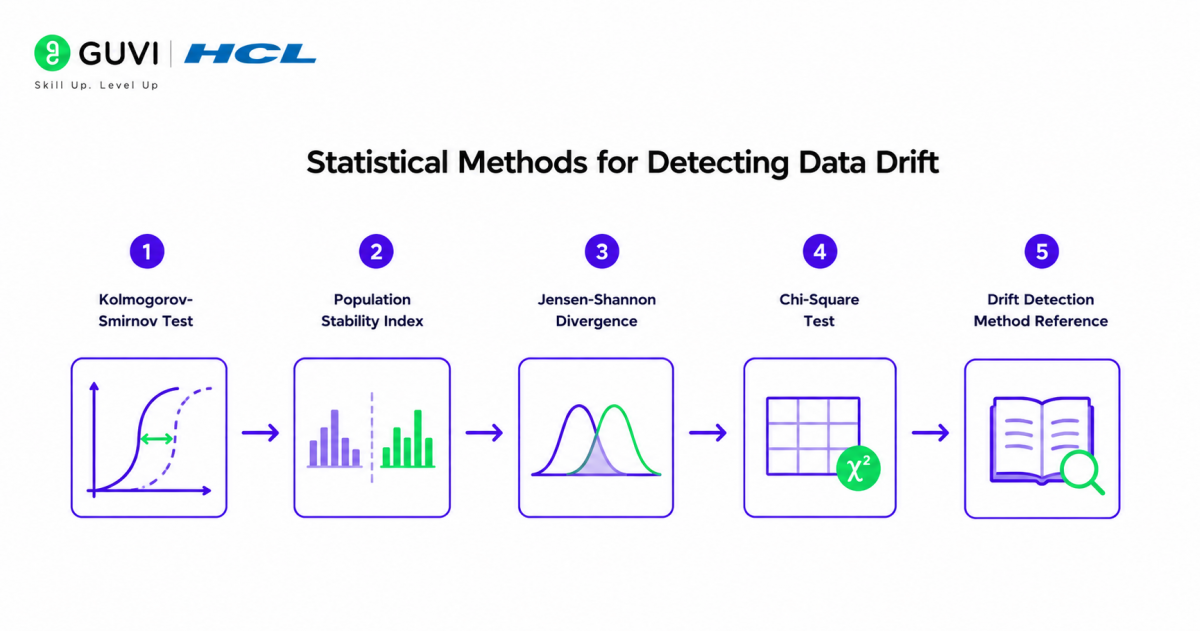
Statistical hypothesis tests compare the distribution of production data against a reference distribution from training or a recent stable period.
- Kolmogorov-Smirnov Test
The KS test measures the maximum difference between two cumulative distribution functions. It works for continuous numerical features and is sensitive to differences in both location and shape. A p-value below a threshold like 0.05 suggests the two distributions are statistically different.
KS test is easy to implement and interpret but can be overly sensitive with large datasets, flagging statistically significant but practically irrelevant differences.
- Population Stability Index
PSI measures how much a numerical distribution has shifted between two periods. It is widely used in financial services credit scoring and insurance where regulatory requirements demand explicit drift monitoring.
A PSI below 0.1 indicates minimal shift. Between 0.1 and 0.25 indicates moderate shift requiring investigation. Above 0.25 indicates significant shift requiring model review or retraining.
- Jensen-Shannon Divergence
JS divergence measures the similarity between two probability distributions on a scale from 0 to 1. It works for both continuous and categorical features and is symmetric, unlike the related KL divergence. Higher JS divergence indicates more significant distributional difference.
- Chi-Square Test
For categorical features, the chi-square test compares observed category frequencies in production against expected frequencies from training. It detects changes in category prevalence and the appearance of new categories.
Stripe’s fraud detection team published research showing that fraud pattern drift can be measurable within 48 hours of a new attack vector appearing, making weekly drift detection cadences insufficient for high-stakes financial systems. Their production fraud models use hour-level drift monitoring with automated model updates that can retrain and deploy within four hours of significant drift detection, one of the fastest automated retraining cycles documented in production ML literature.

Drift Detection Method Reference
| Method | Feature Type | Key Parameter | Threshold Interpretation |
| KS Test | Continuous | p-value | Below 0.05 signals drift |
| PSI | Continuous | PSI score | Above 0.25 signals significant drift |
| JS Divergence | Both | Divergence 0 to 1 | Above 0.1 warrants investigation |
| Chi-Square | Categorical | p-value | Below 0.05 signals drift |
| Wasserstein Distance | Continuous | Distance value | Depends on feature scale |
A 2022 study by Gartner found that 85 percent of ML projects fail to reach production, and of those that do reach production, approximately 75 percent experience significant performance degradation within 12 months due to drift that was not detected and acted upon in time. This degradation is often gradual enough that it goes unnoticed without explicit monitoring, making model drift detection one of the highest-ROI investments an ML team can make after initial deployment.
Building a Drift Detection Pipeline
A production drift detection pipeline has four components that operate continuously after model deployment.
Reference baseline: At deployment time, compute and store the statistical properties of the training or validation dataset, including feature distributions, correlation matrices, and prediction output distributions. This baseline is what production data is compared against.
Production data logging: Every prediction request logs the input features and model output to a data store. This creates the production dataset that monitoring compares against the baseline.
Scheduled drift tests: Periodically, typically daily or weekly depending on data volume, run statistical drift tests comparing recent production data against the baseline. The frequency should be calibrated to the rate of change in your domain.
Alerting and response: When drift tests indicate significant shift, alerts are sent to the ML team. Response options range from investigation only through model recalibration to full retraining and redeployment, depending on drift severity.
Want to build production MLOps skills covering model monitoring, drift detection, and automated retraining pipelines? Explore HCL GUVI’s Artificial Intelligence & Machine Learning Course, designed to help you develop the practical ML engineering foundations that real production AI roles demand.
Conclusion
Model drift detection is not optional for production ML systems that must remain accurate over time. Without it, models degrade silently until the degradation becomes severe enough for users or business stakeholders to notice, at which point significant harm has already occurred.
The three types of drift, data drift, concept drift, and prediction drift, require different detection approaches and monitoring cadences, and the ground truth delay problem means monitoring cannot rely solely on accuracy metrics.
FAQs
What is model drift detection?
Model drift detection is the practice of monitoring deployed ML models to identify when their predictions become less accurate due to changes in input data distributions or the relationship between inputs and outputs after deployment.
What are the three types of model drift?
Data drift is when input feature distributions change. Concept drift is when the relationship between inputs and correct outputs changes. Prediction drift is when the model’s output distribution shifts, often as a downstream effect of data or concept drift.
How do you detect data drift without ground truth labels?
Compare the statistical distribution of production input features against the training baseline using tests like KS test, PSI, and JS divergence. These detect distributional changes in inputs without requiring knowledge of the correct output.
What is the Population Stability Index used for?
PSI measures how much a distribution has shifted between two periods. A PSI above 0.25 indicates significant drift requiring model review. It is widely used in financial services for regulatory compliance monitoring of credit models.
Which tools are available for drift detection?
Open-source options include Evidently AI, WhyLogs, and Alibi Detect. Commercial options include Arize AI and Fiddler AI. Cloud-managed options include Amazon SageMaker Model Monitor and Azure ML Monitor.
How often should you run drift detection?
It depends on the domain and how quickly data changes. Most teams run daily or weekly drift checks. High-stakes real-time systems like fraud detection may require hourly monitoring with automated response pipelines.
Success Stories

About the Author
HCL GUVI
This article was selected and published as part of the HCL GUVI AI Blogathon 2026, an initiative designed to encourage students, AI enthusiasts, and aspiring tech writers to simplify complex AI concepts through impactful technical content. The contest recognized high-quality, original, and insightful AI-focused blogs, with selected authors receiving publication opportunities on the HCL GUVI blog platform along with official author credits and recognition.
View all posts by HCL GUVI
Connect with me @















Did you enjoy this article?