


Artificial Intelligence and Machine Learning Articles
Finance Manager to Data Analytics: Career Growth, Salary and Seniority
How to Evaluate LLM Outputs in Production Deployments
AI/ML Skills Gap 2026: Why Companies Can't Find Job-Ready Talent
20 AI/ML Interview Questions Recruiters Can Use Without a Tech Background - Best Guide


Get In Touch For Details! Request More Information
Monitoring ML Models in Production: Key Metrics
Sep 01, 2026 4 Min Read 361 Views
(Last Updated)
Deploying a machine learning model is not the finish line. It is the beginning of a continuous responsibility to ensure the model keeps doing what it was designed to do as the world around it changes. ML model monitoring is the practice that makes this possible. Without it, models degrade silently, data pipelines fail quietly, and business outcomes erode before anyone realizes the model is the cause.
Table of contents
- TL;DR Summary
- Model Performance Metrics
- Classification Models
- The Ground Truth Delay Problem
- Data Quality Metrics
- System Health Metrics
- Monitoring Tools for Production ML
- Conclusion
- FAQs
- What is ML model monitoring?
- What are the four categories of ML monitoring metrics?
- Why is monitoring model accuracy directly in production difficult?
- What is the most useful early warning metric for model degradation?
- Which tools are best for ML model monitoring?
- How do you set alert thresholds for ML monitoring?
TL;DR Summary
- ML model monitoring tracks four categories of metrics in production: model performance, data quality, system health, and business impact
- Performance metrics like accuracy, precision, recall, and AUC require ground truth labels that are often delayed or unavailable in real production systems
- Data quality metrics including feature distributions, missing value rates, and schema violations detect problems upstream of model predictions without requiring labels
- System metrics like latency, throughput, and error rates measure the infrastructure health of the model serving layer
Model Performance Metrics
Model performance metrics answer the most important question: is the model making accurate predictions? Which metrics you track depends on the type of model and prediction task.
Classification Models
| Metric | Definition | When It Matters Most |
| Accuracy | Fraction of correct predictions | Balanced class distributions |
| Precision | Fraction of positive predictions that are correct | When false positives are costly |
| Recall | Fraction of actual positives correctly identified | When false negatives are costly |
| F1 Score | Harmonic mean of precision and recall | Imbalanced classes |
| AUC-ROC | Area under the ROC curve | Ranking quality across thresholds |
| Log Loss | Average log probability of correct class | Calibration of predicted probabilities |
Want to build production MLOps skills covering model monitoring, drift detection, and reliable deployment pipelines? Explore HCL GUVI’s Artificial Intelligence & Machine Learning Course, designed to help you develop the practical ML engineering skills that production AI roles demand.
The Ground Truth Delay Problem
The fundamental challenge with performance metrics in production is that ground truth labels are often not available immediately after a prediction is made. A churn prediction model makes predictions today but does not know whether the prediction was correct until the customer either churns or remains active over the next 30 days. A loan default model waits months for repayment behavior to confirm predictions.
This delay means that by the time you detect accuracy degradation through direct measurement, significant harm may already have occurred. This is why data quality metrics and proxy metrics are essential complements to direct performance measurement.
Read More: MLflow Experiment Tracking: A Complete Beginner’s Guide
Data Quality Metrics
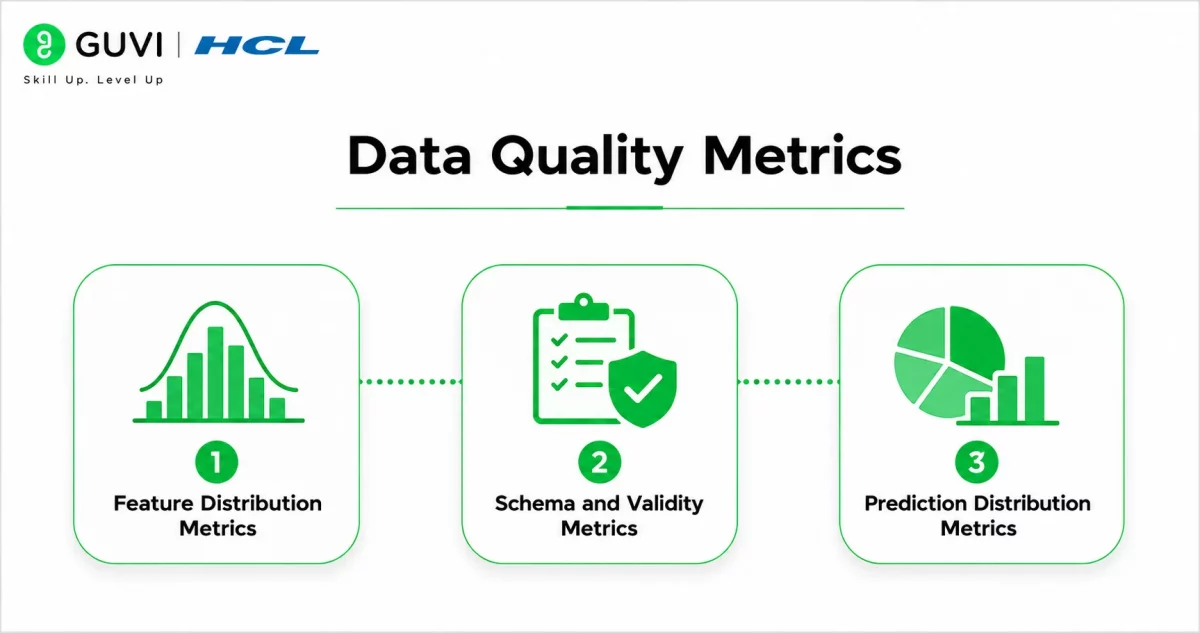
Data quality metrics monitor the inputs to the model without requiring any knowledge of the correct output. They catch problems in the data pipeline, changes in the real world, and distribution shifts before those problems manifest as accuracy degradation.
- Feature Distribution Metrics
For each feature in the model, monitor how its distribution in production compares to its distribution during training. Statistical tests including KS test for continuous features and chi-square test for categorical features detect significant shifts.
| Distribution Metric | Feature Type | Alert Signal |
| Mean and standard deviation | Continuous | Shift beyond training range |
| Percentile values (p5, p25, p75, p95) | Continuous | Tails expanding or contracting |
| Unique value count | Categorical | New categories appearing |
| Category frequency | Categorical | Frequency ratios shifting |
| Missing value rate | All | Rate increasing above training baseline |
- Schema and Validity Metrics
Beyond distribution, monitor whether features conform to expected schemas and value ranges.
Null rate per feature: if a feature that was rarely null during training starts arriving with 20 percent null values, a data pipeline has probably broken. Out-of-range values: a feature with a training range of 0 to 100 receiving values of 50,000 indicates either a data pipeline error or a genuine but extreme shift. Type mismatches: a feature expected as a float arriving as a string indicates an upstream schema change.
- Prediction Distribution Metrics
Monitor the distribution of the model’s own output predictions as a leading indicator of upstream data changes.
If a binary classifier that predicted class 1 for 25 percent of inputs during evaluation starts predicting class 1 for 60 percent of inputs in production, something significant has changed upstream. Prediction distribution monitoring requires no labels and often detects drift before statistical tests on individual features do.
Airbnb’s ML platform team published research showing that implementing automated data quality monitoring reduced the mean time to detect ML-related production incidents from 4.2 days to 6 hours. The majority of detected incidents were traced to upstream data pipeline changes that altered feature distributions before manifesting as model accuracy degradation, confirming that data quality monitoring provides significantly earlier detection than accuracy-based monitoring alone.
System Health Metrics
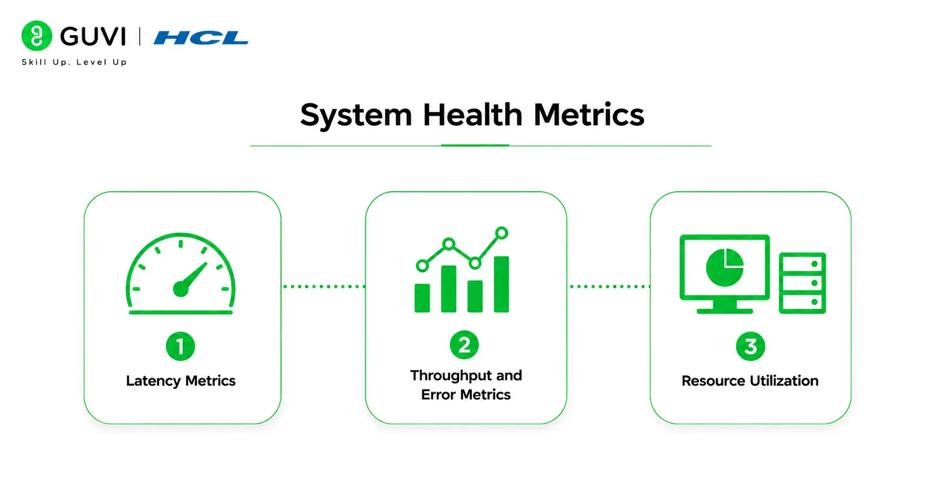
System health metrics measure the model serving infrastructure. They are independent of ML concerns but are essential for ensuring predictions actually reach users reliably.
- Latency Metrics
Track prediction latency at multiple percentiles rather than just the average. The 50th percentile (median) tells you what a typical user experiences. The 95th and 99th percentiles tell you what your worst-case users experience. The maximum tells you about outlier requests that may be timing out.
| Latency Metric | What It Reveals |
| p50 latency | Typical user experience |
| p95 latency | Experience for 1 in 20 requests |
| p99 latency | Experience for 1 in 100 requests |
| p99.9 latency | Worst-case tail behavior |
| Timeout rate | Fraction of requests exceeding SLA |
Alert on p99 latency increasing rather than average latency. Average latency hides tail behavior that significantly degrades user experience for a meaningful fraction of users.

- Throughput and Error Metrics
Requests per second measures serving load and helps correlate model behavior changes with traffic patterns. Error rate measures the fraction of requests that fail with an exception or error response rather than a prediction. A sudden spike in error rate often indicates an infrastructure problem rather than a model problem.
HTTP status code distribution, specifically the rate of 4xx and 5xx responses, provides a quick health signal for REST API-served models. Model server OOM errors indicate the model is running out of memory, often due to larger-than-expected batch sizes or memory leaks in the serving container.
- Resource Utilization
CPU and memory utilization on serving instances. GPU utilization and GPU memory utilization for GPU-served models. These metrics inform scaling decisions and detect resource leaks before they cause serving failures.
LinkedIn’s production ML monitoring system tracks over 5,000 distinct metrics across their deployed models, including feed ranking, job recommendations, and connection suggestions. Their engineering team documented that the majority of production ML incidents they investigate are first detected by data quality and system metrics rather than model accuracy metrics, because accuracy metrics typically lag the underlying problem by days while data quality violations are detectable in real time.
Monitoring Tools for Production ML
| Tool | Primary Category | Key Strength |
| Evidently AI | Data quality and drift | Open-source, comprehensive reports |
| Arize AI | Performance and drift | Real-time monitoring, explainability |
| Fiddler AI | Performance monitoring | Bias detection, NLP support |
| WhyLogs / WhyLabs | Data quality | Lightweight profiling, scalable |
| Prometheus + Grafana | System metrics | Universal infrastructure monitoring |
| Datadog | System and custom metrics | Enterprise monitoring, ML integrations |
| Amazon SageMaker Monitor | All categories | AWS-native, managed service |
| Azure ML Monitor | All categories | Azure-native, dataset drift detection |
Most production ML teams combine multiple tools: an ML-specific tool like Evidently AI or Arize AI for model performance and data quality, and a general infrastructure monitoring stack like Prometheus and Grafana or Datadog for system health metrics.
Want to build production MLOps skills covering model monitoring, drift detection, and reliable deployment pipelines? Explore HCL GUVI’s Artificial Intelligence & Machine Learning Course, designed to help you develop the practical ML engineering skills that production AI roles demand.
Conclusion
Effective ML model monitoring in production requires tracking all four categories of metrics simultaneously rather than focusing on any single one. Model performance metrics provide the most direct signal but suffer from ground truth delays.
Data quality metrics provide the earliest warning of upstream problems. System health metrics ensure predictions reach users reliably. Business impact metrics confirm that technical model quality translates to real-world value.
FAQs
What is ML model monitoring?
ML model monitoring is the continuous tracking of model performance, data quality, system health, and business outcomes for deployed machine learning models to detect degradation and failures before they significantly impact users.
What are the four categories of ML monitoring metrics?
Model performance metrics measuring prediction accuracy, data quality metrics measuring input distributions, system health metrics measuring serving infrastructure, and business impact metrics measuring real-world outcomes.
Why is monitoring model accuracy directly in production difficult?
Ground truth labels are often delayed or unavailable immediately after predictions are made. A churn model may wait 30 days to know if its predictions were correct, creating a monitoring gap where problems go undetected during the label delay period.
What is the most useful early warning metric for model degradation?
Data quality metrics including feature distribution drift and prediction distribution shifts are the most reliable early warning signals because they are detectable in real time without waiting for ground truth labels.
Which tools are best for ML model monitoring?
Evidently AI and WhyLogs are widely used open-source options for data quality and drift monitoring. Arize AI and Fiddler AI are commercial options with richer features. Prometheus and Grafana or Datadog handle system health metrics for most teams.
How do you set alert thresholds for ML monitoring?
Use statistical conventions as starting points: PSI above 0.25 for data drift, KS test p-value below 0.05. Add relative thresholds comparing against rolling baselines for performance metrics and absolute thresholds for hard SLA limits like latency.
Success Stories

About the Author
HCL GUVI
This article was selected and published as part of the HCL GUVI AI Blogathon 2026, an initiative designed to encourage students, AI enthusiasts, and aspiring tech writers to simplify complex AI concepts through impactful technical content. The contest recognized high-quality, original, and insightful AI-focused blogs, with selected authors receiving publication opportunities on the HCL GUVI blog platform along with official author credits and recognition.
View all posts by HCL GUVI
Connect with me @


















Did you enjoy this article?