


Artificial Intelligence and Machine Learning Articles
Finance Manager to Data Analytics: Career Growth, Salary and Seniority
How to Evaluate LLM Outputs in Production Deployments
AI/ML Skills Gap 2026: Why Companies Can't Find Job-Ready Talent
20 AI/ML Interview Questions Recruiters Can Use Without a Tech Background - Best Guide


Get In Touch For Details! Request More Information

A/B Testing for Machine Learning Models
Sep 01, 2026 4 Min Read 403 Views
(Last Updated)
A/B Testing ML Models is a controlled production experiment that compares two model versions using real traffic. Model A is usually the current production model, while Model B is the new candidate. Users are assigned randomly, and both models are evaluated against predefined business, technical, and model-quality metrics. The winning model is rolled out only after statistical and operational checks.
Table of contents
- TL;DR Summary
- What Is A/B Testing ML Models?
- Why Is A/B Testing Important for ML?
- How Does A/B Testing for ML Models Work?
- Control and Treatment Groups
- Choosing the Right Metrics
- Primary Metric
- Model Metrics
- Guardrail Metrics
- How Do You Measure Improvement?
- How Long Should an A/B Test Run?
- A/B Testing Workflow for Production
- Step 1: Define the Objective
- Step 2: Estimate Sample Size
- Step 3: Implement Stable Routing
- Step 4: Start with a Canary
- Step 5: Increase Traffic Gradually
- Step 6: Analyze by Segment
- A/B Testing vs Other Evaluation Methods
- Common Mistakes to Avoid
- Conclusion
- FAQs
- What is A/B testing in machine learning?
- What is the difference between offline testing and A/B testing?
- How should traffic be split between two ML models?
- Which metrics should be used in an ML A/B test?
- How do you know whether an A/B test result is reliable?
- Can a model have better accuracy but worse business performance?
- What is a canary rollout?
- Should every new ML model undergo A/B testing?
TL;DR Summary
- A/B testing compares an existing model with a new candidate model on live traffic.
- Random assignment helps reduce selection bias.
- Business metrics, model metrics, and guardrail metrics should all be tracked.
- Statistical significance does not automatically mean business value.
- Start with a small rollout and increase traffic gradually.
What Is A/B Testing ML Models?
A/B testing ML models means running two versions of a machine learning model at the same time and comparing their outcomes.
The existing model is called the control or Model A. The new version is the treatment or Model B. Traffic is split between them, and each model’s performance is measured using the same evaluation criteria.
For example, an online store may compare:
- Model A: the current recommendation model.
- Model B: a new recommendation model using improved embeddings.
- Primary metric: purchase conversion rate.
- Guardrail metrics: page latency, revenue per visitor, and unsubscribe rate.
A/B testing is different from offline validation. Offline metrics tell you how a model performs on historical data. A/B testing shows how users and real systems respond to it in production.
Why Is A/B Testing Important for ML?
A model can perform better on a test dataset but produce worse business results after deployment.
This happens because:
- Production data may differ from training data.
- Users may react differently to new predictions.
- Small accuracy gains may not change user behavior.
- A more accurate model may be slower or more expensive.
- Improvements for one user group may hurt another group.
A/B testing connects model quality with real-world impact. It helps teams make deployment decisions using evidence instead of assumptions.
Example Box
An advertising model may improve offline click-through prediction but reduce actual revenue because it recommends low-value clicks. A/B testing exposes this difference.
A/B testing for ML models runs two (or more) model variants in parallel on randomized user traffic and compares real-world metrics like CTR, revenue, or latency to decide which performs better with statistical confidence. Learn AI & ML with HCL GUVI’s Artificial Intelligence and Machine Learning course.
How Does A/B Testing for ML Models Work?
A typical experiment follows these steps:
- Define the business and model objective.
- Select primary and guardrail metrics.
- Deploy Model A and Model B.
- Randomly assign users or requests.
- Log predictions, outcomes, and system behavior.
- Run the test for a predefined period.
- Analyze the results.
- Gradually roll out the better model.
AWS describes a similar production process: deploy multiple model variants, route traffic between them, evaluate performance, and increase traffic to the selected variant.
Control and Treatment Groups
The control group receives the current production model. The treatment group receives the candidate model.
A common split is:
- 90% Model A and 10% Model B for an initial canary test.
- 50% Model A and 50% Model B for a full comparison.
Assign users consistently. If possible, assign at the user or account level rather than randomly changing the model on every request.
This prevents a user from receiving inconsistent experiences and reduces cross-contamination between groups.
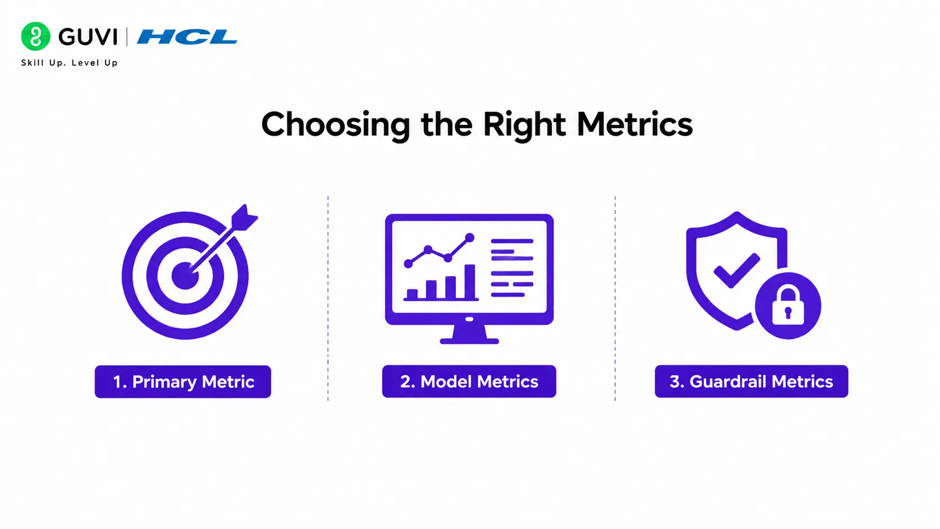
Choosing the Right Metrics
A strong A/B test uses three metric categories.
1. Primary Metric
This is the main outcome used to determine success.
Examples include:
- Conversion rate.
- Click-through rate.
- Revenue per user.
- Fraud detection recall.
- Customer retention.
- Recommendation engagement.
2. Model Metrics
These measure prediction quality.
Examples include:
- Accuracy.
- Precision.
- Recall.
- F1 score.
- Log loss.
- Area under the ROC curve.
- Calibration error.
3. Guardrail Metrics
Guardrails help detect unintended damage.
Examples include:
- Latency.
- Error rate.
- Infrastructure cost.
- Customer complaints.
- Churn.
- Fairness metrics.
- Safety violations.
Best Practice: Define one primary metric before the experiment starts. Treat secondary metrics as supporting evidence rather than repeatedly searching for whichever metric looks best.
How Do You Measure Improvement?
For a metric where higher values are better, relative improvement can be calculated as follows:
Formula Box: Relative Improvement
Relative Improvement=MB−MAMA×100\text{Relative Improvement} = \frac{M_B-M_A}{M_A} \times 100Relative Improvement=MAMB−MA×100
Where:
- MAM_AMA is the metric for Model A.
- MBM_BMB is the metric for Model B.
For example, if Model A has a 5% conversion rate and Model B has a 5.5% conversion rate:
5.5−5.05.0×100=10%\frac{5.5-5.0}{5.0}\times100 = 10\%5.05.5−5.0×100=10%
The absolute improvement is 0.5 percentage points, while the relative improvement is 10%. Always report both because they communicate different things. For error metrics where lower is better, reverse the comparison:
Formula Box: Error Reduction
Error Reduction=EA−EBEA×100\text{Error Reduction} = \frac{E_A-E_B}{E_A} \times 100Error Reduction=EAEA−EB×100How Long Should an A/B Test Run?
There is no universal test duration. It depends on traffic volume, conversion frequency, expected effect size, and the amount of natural variation.
Run the test long enough to capture:
- Weekday and weekend behavior.
- Normal traffic variation.
- Delayed outcomes.
- Seasonal or campaign effects.
- Enough conversions or events for analysis.
Do not stop the experiment immediately after seeing a temporary improvement. Repeatedly checking the result and stopping early can increase false-positive conclusions.

A/B Testing Workflow for Production
Step 1: Define the Objective
Write a specific hypothesis:
“Model B will increase completed purchases without increasing page latency by more than 50 milliseconds.”
This is better than saying, “Model B should perform better.”
Step 2: Estimate Sample Size
Use baseline performance, expected improvement, significance level, and statistical power to estimate the required sample.
This helps prevent underpowered experiments that cannot distinguish meaningful improvement from random variation.
Step 3: Implement Stable Routing
Use a feature flag or routing layer to assign users consistently.
Log:
- User or experiment ID.
- Model version.
- Input timestamp.
- Prediction.
- Outcome.
- Latency.
- Errors.
- Relevant context features.
Step 4: Start with a Canary
Send a small percentage of traffic to Model B. Watch for crashes, latency increases, unusual predictions, and serious regressions.
Step 5: Increase Traffic Gradually
If the canary is healthy, increase traffic to 25%, 50%, and eventually 100%, depending on the results.
Step 6: Analyze by Segment
Overall averages can hide problems. Compare performance by:
- Device type.
- Geography.
- Customer segment.
- New versus returning users.
- Language.
- Data quality.
- High- and low-volume groups.
A/B Testing vs Other Evaluation Methods
| Method | Main purpose | Uses live traffic? | Best use |
| Offline evaluation | Test on historical data | No | Fast model comparison |
| Cross-validation | Estimate generalization | No | Model selection during development |
| Shadow deployment | Run a model without affecting users | Yes | Check infrastructure and predictions |
| Canary release | Expose a small group to a new model | Yes | Detect production failures |
| A/B testing | Compare business and model outcomes | Yes | Controlled decision-making |
| Multivariate testing | Test multiple changes together | Yes | Complex product experiments |
A/B testing is powerful, but it should not be the first evaluation stage. Use offline validation and shadow testing to catch obvious problems before exposing users to the candidate model.
Common Mistakes to Avoid
- Splitting traffic non-randomly.
- Changing the primary metric after seeing the results.
- Testing for too short a period.
- Stopping as soon as a metric becomes significant.
- Ignoring latency and infrastructure cost.
- Measuring only accuracy instead of business outcomes.
- Assigning users to different models on every request.
- Ignoring delayed conversions or long-term effects.
- Running many experiments without correcting for multiple comparisons.
- Deploying a winner without monitoring after rollout.
A model with higher offline accuracy can produce lower revenue or engagement in production if its predictions change user behavior. A/B testing should measure not only whether Model B is statistically better, but whether its improvement is large enough to justify deployment.
A/B testing for ML models runs two (or more) model variants in parallel on randomized user traffic and compares real-world metrics like CTR, revenue, or latency to decide which performs better with statistical confidence. Learn AI & ML with HCL GUVI’s Artificial Intelligence and Machine Learning course.
Conclusion
A/B Testing ML Models provides a reliable way to compare a production model with a new candidate using real traffic and measurable outcomes. It reveals whether a model improvement survives contact with real users, production systems, and business constraints.
The strongest experiments combine random assignment, clear metrics, statistical analysis, guardrails, and gradual rollout. Do not choose a model simply because it has a better offline score. Choose it because it creates meaningful improvement without introducing unacceptable cost, latency, or user impact.
FAQs
What is A/B testing in machine learning?
A/B testing in machine learning compares two model versions on real traffic. The current model acts as the control, while the new model acts as the treatment.
What is the difference between offline testing and A/B testing?
Offline testing uses historical or held-out data. A/B testing evaluates models with live users or production requests and measures real-world outcomes.
How should traffic be split between two ML models?
Start with a small percentage for the new model, such as 5% or 10%. If the system remains stable, increase traffic gradually for a stronger comparison.
Which metrics should be used in an ML A/B test?
Use a primary business metric, model-quality metrics, and guardrails such as latency, error rate, cost, fairness, and user complaints.
How do you know whether an A/B test result is reliable?
Use a sufficiently large sample, predefined success criteria, confidence intervals, statistical testing, and a test duration that captures normal traffic variation.
Can a model have better accuracy but worse business performance?
Yes. Accuracy may not reflect user behavior, business value, latency, or revenue. That is why production metrics should be included in the experiment.
What is a canary rollout?
A canary rollout sends a small percentage of traffic to a new model before increasing exposure. It helps detect failures and harmful regressions early.
Should every new ML model undergo A/B testing?
Not necessarily. Offline testing or shadow deployment may be enough for internal systems or low-impact changes. A/B testing is especially useful when the model directly affects user behavior or business outcomes.
Success Stories

About the Author
HCL GUVI
This article was selected and published as part of the HCL GUVI AI Blogathon 2026, an initiative designed to encourage students, AI enthusiasts, and aspiring tech writers to simplify complex AI concepts through impactful technical content. The contest recognized high-quality, original, and insightful AI-focused blogs, with selected authors receiving publication opportunities on the HCL GUVI blog platform along with official author credits and recognition.
View all posts by HCL GUVI
Connect with me @


















Did you enjoy this article?