A Comprehensive Guide to Data Exploration
Sep 21, 2024 6 Min Read 1455 Views
(Last Updated)
In the ever-evolving world of data science, understanding and interpreting data effectively is important. Data exploration is the foundation for any data analysis project, allowing data scientists to explore their datasets, understand hidden patterns, and generate insightful hypotheses.
In this blog, we will explore the essential steps and techniques of data exploration, ensuring you can confidently understand your data and extract valuable insights. Learning data exploration will equip you with the skills needed to transform raw data into meaningful knowledge. Let’s begin!
Table of contents
- What is Data Exploration?
- A Comprehensive Guide to Data Exploration
- Preparing for Data Exploration
- Benefits of Data Exploration
- Applications of Data Exploration
- Identifying Relationships and Patterns
- Tips for Effective Pattern Identification
- Tools and Libraries for Data Exploration
- Conclusion
- FAQs
- What is data exploration and why is it important?
- What are the key steps involved in data exploration?
- What tools and libraries are commonly used for data exploration?
What is Data Exploration?
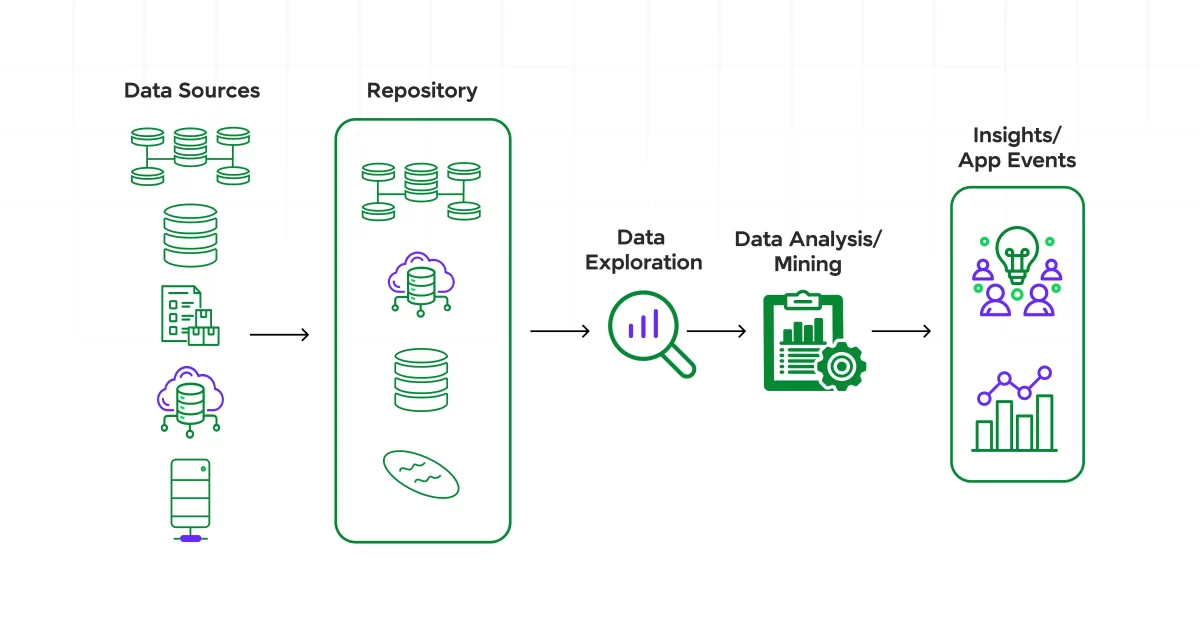
Data exploration is the initial step in the data analysis process where analysts examine and investigate a dataset to understand its main characteristics, patterns, and potential insights. It involves:
- Summarizing key statistics (mean, median, standard deviation, etc.)
- Visualizing data through charts, graphs, and plots
- Identifying trends, outliers, and relationships between variables
- Checking data quality and handling missing or inconsistent values
- Formulating initial hypotheses about the data
The goal is to gain a comprehensive understanding of the dataset before proceeding with more advanced analysis or modeling. This process helps analysts:
- Identify potential research questions
- Detect data issues early
- Choose appropriate analytical techniques
- Understand unexpected patterns or relationships
Data exploration is important for informed decision-making in subsequent analysis stages.
Before we move into the next section, ensure you have a good grip on data science essentials like Python, MongoDB, Pandas, NumPy, Tableau & PowerBI Data Methods. If you are looking for a detailed course on Data Science, you can join GUVI’s Data Science Course with Placement Assistance. You’ll also learn about the trending tools and technologies and work on some real-time projects.
Additionally, if you want to explore Python through a self-paced course, try GUVI’s Python course.
Now, let’s learn data exploration in detail, covering the essential steps and techniques.
A Comprehensive Guide to Data Exploration
Let’s explore the key aspects of data exploration, from preparation to advanced techniques, equipping you with the knowledge and tools to gain valuable insights from your data.
Preparing for Data Exploration
Before exploring the actual exploration process, it’s essential to lay the groundwork for a successful analysis. This preparatory phase involves several key steps:
a) Define Your Objectives
Start by clearly outlining what you hope to achieve through your data exploration. Are you looking to identify trends, understand relationships between variables, or detect anomalies? Having well-defined objectives will guide your exploration process and help you focus on the most relevant aspects of your data.
b) Understand the Data Context
Familiarize yourself with the background of your dataset. This includes understanding how the data was collected, what each variable represents, and any known limitations or biases in the data. This contextual knowledge is important for interpreting your findings accurately.
c) Ensure Data Quality
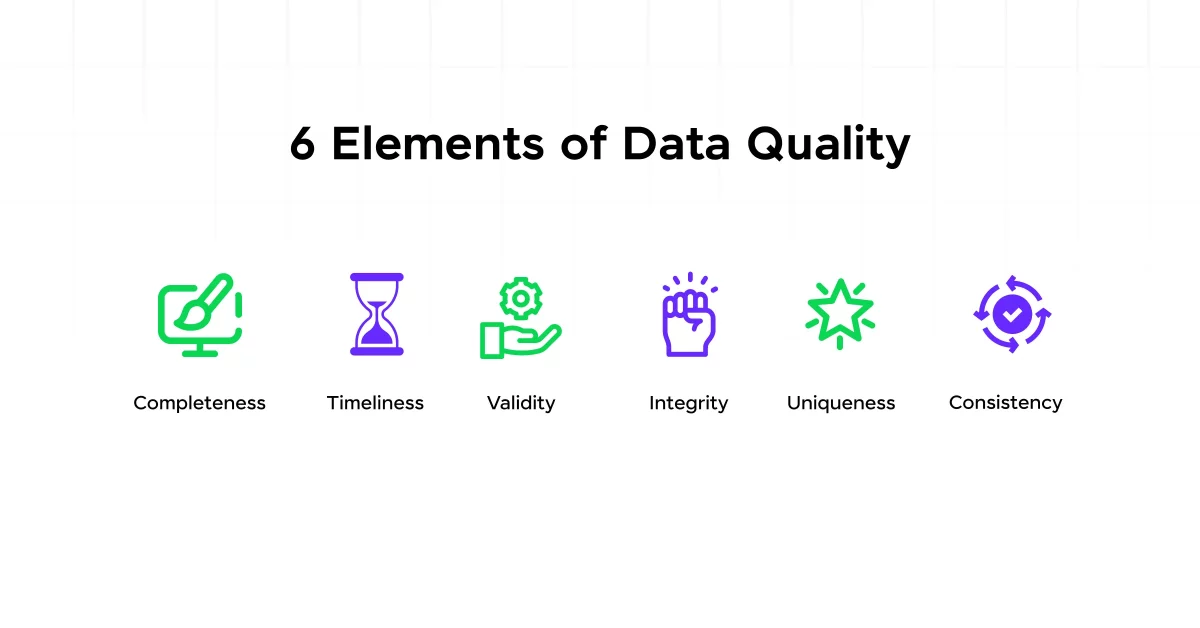
Data quality is important for meaningful exploration. Begin by checking for missing values, duplicates, and outliers. Consider the following:
- How will you handle missing data? (e.g., imputation, deletion)
- Are there any obvious errors or inconsistencies in the data?
- Do you need to standardize or normalize any variables?
d) Choose Appropriate Tools
Select the tools and software that best suit your needs and skill level. Popular choices include:
- Python (with libraries like Pandas, NumPy, and Matplotlib)
- R (with packages like tidyverse and ggplot2)
- SQL for database querying
- Specialized data exploration tools like Tableau or Power BI
e) Create a Data Dictionary
Develop a comprehensive data dictionary that describes each variable in your dataset. Include information such as:
- Variable name and description
- Data type (e.g., numeric, categorical, date)
- Possible values or range
- Units of measurement (if applicable)
- Any relevant notes or caveats
f) Set Up Your Environment
Prepare your working environment by:
- Importing necessary libraries and modules
- Loading your dataset
- Setting up version control (e.g., Git) to track changes in your analysis
g) Sample Your Data (if necessary)
If you’re working with a very large dataset, consider using a representative sample for initial exploration. This can speed up your analysis and help you iterate quickly. Ensure your sampling method maintains the overall characteristics of the full dataset.
By thoroughly preparing for your data exploration, you set the stage for a more efficient and effective analysis process. This groundwork allows you to approach your data with a clear focus, ensuring that you ask the right questions and apply the most appropriate techniques as you go deeper into your exploration.
Also Read: What is Exploratory Data Analysis (EDA) in Data Science? Types and Tools
Benefits of Data Exploration
The benefits of data exploration are as follows:
1. Improved Data Understanding
Data exploration allows analysts and stakeholders to gain a comprehensive understanding of the dataset. By examining the data through various lenses, one can identify patterns, trends, and anomalies that might not be immediately obvious. This deeper insight helps in making informed decisions and designing effective data models.
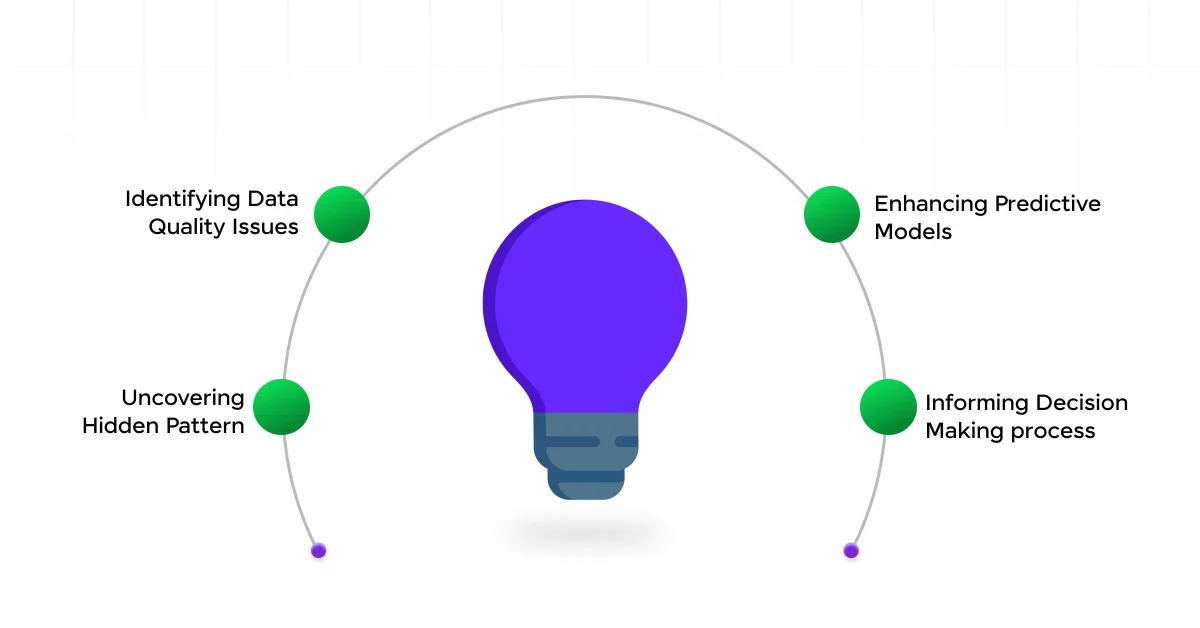
2. Identifying Data Quality Issues
Through data exploration, inconsistencies, missing values, and outliers in the dataset can be detected early on. Addressing these issues before proceeding to the modeling phase ensures that the analysis is based on accurate and reliable data, leading to more robust and valid results.
3. Hypothesis Generation
Exploring data can spark new ideas and hypotheses about the relationships and underlying mechanisms within the data. This exploratory phase is important for formulating research questions and guiding further in-depth analysis, ensuring that subsequent analyses are grounded in observed data patterns.
4. Informed Feature Selection
Data exploration aids in identifying the most relevant variables for analysis and modeling. By understanding which features have the most significant impact, analysts can focus on the most predictive and informative variables, improving model performance and reducing computational complexity.
5. Enhanced Data Visualization
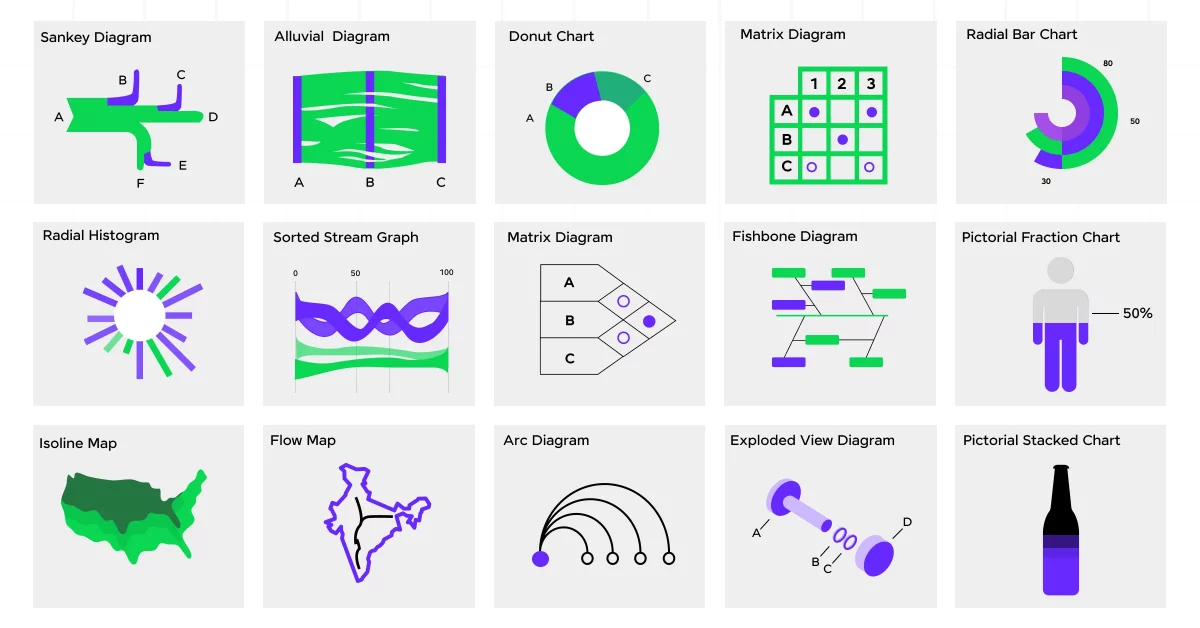
Visualizing data through graphs, charts, and other visual tools is a key component of data exploration. These visualizations help in intuitively understanding the data’s structure and distribution, making it easier to communicate findings and insights to stakeholders who may not be familiar with statistical or technical details.
6. Risk Mitigation
By exploring the data thoroughly, potential risks and pitfalls in the dataset can be identified early. This proactive approach allows for mitigating risks associated with biased data, incorrect assumptions, or overlooked variables, leading to more accurate and reliable outcomes.
7. Guiding Data Cleaning and Preprocessing
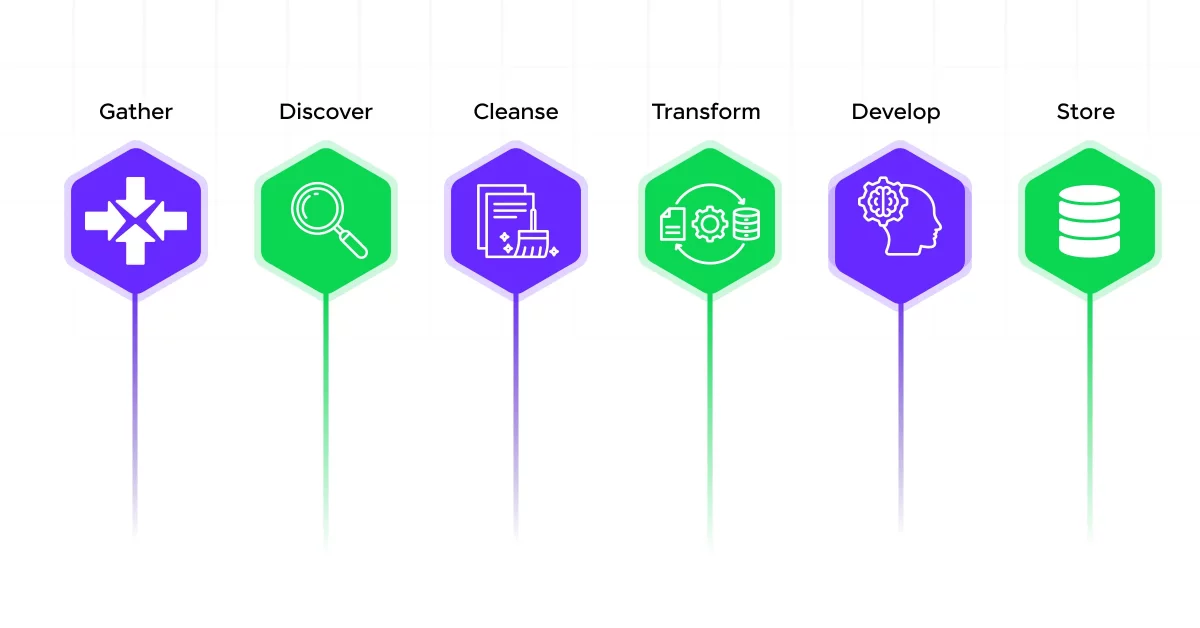
Data exploration informs the data cleaning and preprocessing steps by highlighting areas that need attention. Whether it’s normalizing data, handling missing values, or transforming variables, a clear understanding of the data’s state ensures that these processes are targeted and effective.
Applications of Data Exploration
The applications of data exploration are as follows:
1. Market Research and Consumer Insights
Data exploration is extensively used in market research to understand consumer behavior, preferences, and trends. By analyzing customer data, companies can segment their market, identify target demographics, and tailor their marketing strategies to meet the specific needs and preferences of different consumer groups. This helps businesses in crafting personalized marketing campaigns and improving customer satisfaction.
2. Healthcare and Medical Research
In the healthcare industry, data exploration is important for understanding patterns and correlations in patient data. It can help in identifying risk factors for diseases, understanding treatment outcomes, and improving patient care. Researchers can explore medical datasets to find insights that lead to better diagnostic tools, treatment plans, and preventive measures, ultimately enhancing public health outcomes.
3. Financial Analysis and Fraud Detection
Financial institutions use data exploration to analyze large volumes of transaction data for patterns that indicate potential fraud. By exploring financial data, analysts can detect unusual activities, identify risk factors, and develop models to predict fraudulent behavior. Additionally, data exploration helps in portfolio management, investment analysis, and identifying market trends.
4. Sales and Operations
Sales and operations teams use data exploration to optimize their processes and strategies. By examining sales data, companies can identify top-performing products, understand sales trends, and forecast future demand. Operations teams use data exploration to streamline supply chain management, improve inventory control, and enhance overall operational efficiency.
5. Social Media and Sentiment Analysis
Data exploration is applied to social media data to understand public sentiment and opinions. By analyzing tweets, posts, and comments, organizations can gauge public reaction to events, products, or campaigns. This information is valuable for reputation management, marketing strategy, and customer engagement.
Identifying Relationships and Patterns
As you explore your data, one of the primary goals is to understand meaningful relationships and patterns. This process often involves a combination of statistical techniques, visualization, and domain knowledge. Here are some key approaches to identifying relationships and patterns in your data:
a) Time Series Analysis
If your data has a temporal component, consider these techniques:
- Trend Analysis: Look for long-term increases or decreases in your data.
- Seasonality: Identify recurring patterns at fixed intervals.
- Autocorrelation: Examine the correlation of a signal with a delayed copy of itself.
b) Anomaly Detection
Identifying unusual data points can reveal interesting patterns or data quality issues:
- Statistical Methods: Use techniques like Z-score or Interquartile Range (IQR).
- Machine Learning Methods: Use algorithms like Isolation Forest or One-Class SVM.
c) Association Rule Mining
For categorical data, association rule mining can understand interesting relationships.
d) Segmentation Analysis
Beyond clustering, consider other segmentation techniques:
- RFM (Recency, Frequency, Monetary) Analysis for customer segmentation.
- Cohort Analysis to group users based on shared characteristics.
e) Network Analysis
If your data represents relationships or interactions, network analysis can be insightful.
f) Text Analysis
For textual data, consider techniques like:
- Word Frequency Analysis
- Sentiment Analysis
- Topic Modeling
g) Geospatial Analysis
If your data has geographic components, consider:
- Spatial clustering
- Hotspot analysis
- Distance calculations
Also Read: 5 Key Components of Data Science: An Effective Guide
h) Feature Interaction Analysis
Look for interactions between features that might affect your target variable.
Tips for Effective Pattern Identification
- Combine multiple techniques: Different methods can reveal different aspects of your data.
- Visualize relationships: Plots can often reveal patterns that aren’t obvious in numerical summaries.
- Consider domain knowledge: Not all statistically significant patterns are meaningful in the context of your problem.
- Be wary of spurious correlations: Always consider whether a relationship makes logical sense.
- Iterate and refine: Use initial findings to guide further exploration.
- Validate patterns: Consider splitting your data and checking if patterns hold across different subsets.
Remember, the goal of identifying relationships and patterns is not just to find them, but to understand what they mean in the context of your data and your research questions. Always tie your findings back to your initial objectives and consider their practical implications.
Tools and Libraries for Data Exploration
Effective data exploration often relies on powerful tools and libraries that can handle various data formats, perform complex computations, and create insightful visualizations. Here’s an overview of some popular tools and libraries for data exploration:
- Python Libraries
- R Libraries
- SQL
- Tableau
- Power BI
- Jupyter Notebooks
- Google Colab
- Apache Spark
- Databricks
- D3.js
- Bokeh
Remember, the best tool is often the one you’re most comfortable with and that gets the job done efficiently. As you gain experience, you’ll develop preferences for certain tools in specific situations. The key is to remain flexible and open to learning new tools as the field of data science continues to evolve.
Kickstart your Data Science journey by enrolling in GUVI’s Data Science Course where you will master technologies like MongoDB, Tableau, PowerBI, Pandas, etc., and build interesting real-life projects.
Alternatively, if you would like to explore Python through a Self-paced course, try GUVI’s Python course.
Conclusion
Data exploration is an important step in any data analysis and data science project. It lays the foundation for all subsequent analysis and modeling efforts. By following a systematic approach, using appropriate tools and techniques, and keeping these practical tips in mind, you can gain valuable insights from your data and set the stage for successful data-driven decision-making.
Remember, the goal of data exploration is not just to understand your data, but to generate actionable insights that can drive real-world impact. As you become more experienced, you’ll develop your own strategies and intuitions for effective data exploration. Stay curious, remain open to new approaches, and always strive to tell the story your data is trying to convey.
FAQs
What is data exploration and why is it important?
Data exploration is the initial phase of data analysis where analysts examine the dataset to understand its main characteristics, often with visual methods. It’s important because:
1. It helps identify patterns, trends, and anomalies in the data.
2. It provides insights for hypothesis generation and further analysis.
3. It ensures data quality by detecting errors and inconsistencies early in the analysis process.
What are the key steps involved in data exploration?
The key steps involved in data exploration include:
1. Collecting and importing data
2. Cleaning and preprocessing: Handling missing values, removing duplicates, and transforming data into a suitable format.
3. Descriptive statistics: Calculating summary statistics to understand data distribution and variability.
4. Data visualization: Creating visual representations like histograms, scatter plots, and heat maps to identify patterns and relationships.
5. Exploring multivariate data: Analyzing relationships between multiple variables using techniques like PCA and correlation analysis.
What tools and libraries are commonly used for data exploration?
Several tools and libraries are commonly used for data exploration:
1. Python libraries: Pandas for data manipulation, NumPy for numerical operations, Matplotlib, and Seaborn for visualization.
2. R packages: tidyverse for data manipulation and visualization, ggplot2 for creating detailed plots, and dplyr for data transformation.
3. Specialized tools: Tableau and Power BI for interactive data visualization, and KNIME for data analytics and reporting.













Did you enjoy this article?