


Data Science Articles
How Long Does It Take to Move From BPO to Data Analytics?
How Can a BPO Professional With 5–10 Years of Experience Get a Data Analyst Job?
Can an Operations Assistant Manager Switch to Data Analytics or Data Science?
BPO to Data Analyst : Is It Time to Switch? | Skills, Roadmap & Career Path

Get In Touch For Details! Request More Information
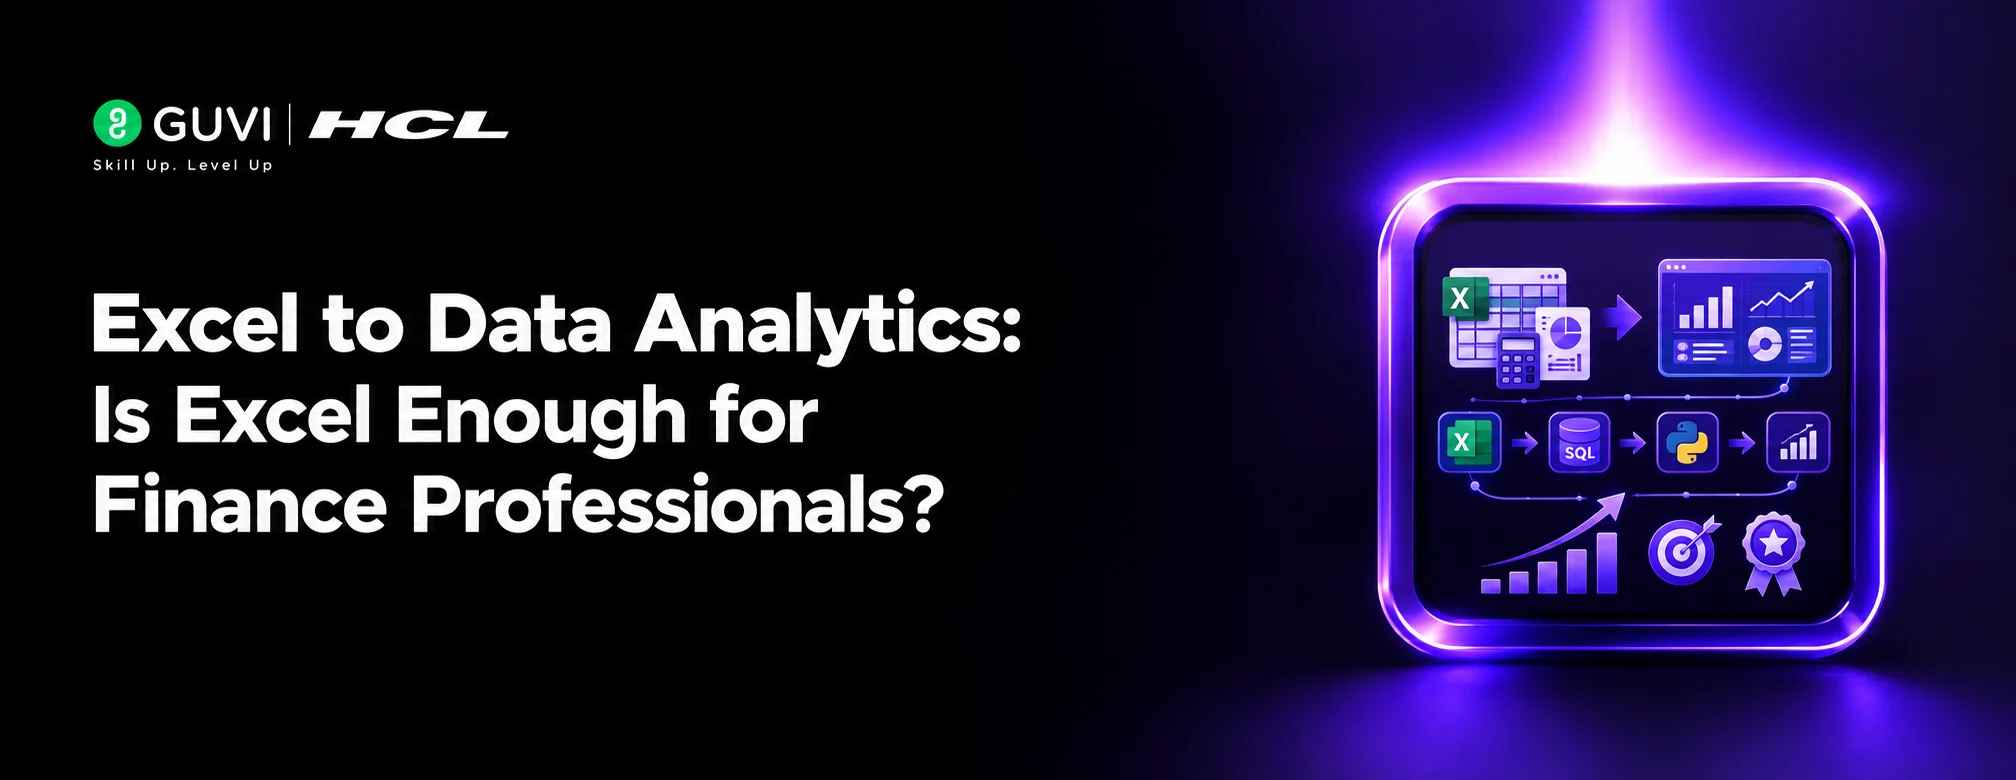
Excel to Data Analytics: Is Excel Enough for Finance Professionals?
Oct 09, 2026 6 Min Read 219 Views
(Last Updated)
You already know Excel. You use it for reports, budgets, reconciliations, MIS, forecasting, or financial analysis. But if you are thinking about moving into data analytics, one question can stop you: Is Excel enough, or do you need to start learning everything from SQL to Python?
The Excel-to-data analytics transition does not mean starting your career from zero. Your finance experience already gives you an understanding of numbers, business processes, reporting, and decision-making. What you need now is to add the technical skills that help you work with larger datasets, databases, dashboards, and automated analysis.
So, Excel is a starting point, not the finish line. The real question is what you should learn after Excel and how to turn those skills into a profile that employers can actually use.
Table of contents
- TL;DR
- Is Excel enough to become a Data Analyst?
- Why is Excel still valuable for finance professionals?
- Where does Excel stop being enough?
- What should you learn after Excel for data analytics?
- Learn SQL
- Learn Power BI
- Strengthen statistics
- Add Python when you are ready
- What does an Excel to data analytics roadmap look like?
- What projects should finance professionals build?
- Budget vs actual analysis
- Profitability analysis
- Expense analysis
- Revenue analysis
- Which roles can you target after moving from Excel to data analytics?
- Are you ready to move from Excel to data analytics?
- Why can a structured program help with the Excel to data analytics transition?
- Conclusion
- FAQs
- Is Excel enough to become a Data Analyst?
- What should I learn after Excel for data analytics?
- Can finance professionals become Data Analysts?
- Do I need coding to move from Excel to data analytics?
- Is Power BI better than Excel for data analytics?
- How can I prove my data analytics skills?
- Can I move from finance to data analytics without starting over?
TL;DR
If you are planning an Excel to data analytics transition, do not abandon Excel. Build on it.
- Excel: Strengthen data cleaning, formulas, PivotTables, and reporting.
- SQL: Learn to retrieve and analyse data from databases.
- Power BI: Build interactive dashboards and communicate insights.
- Statistics: Learn to interpret trends instead of only reporting numbers.
- Python: Add automation and advanced analysis skills when you are ready.
- Projects: Apply these tools to real finance and business problems.
For finance professionals, the advantage is that you already understand the business side of data. Your next step is to combine that experience with technical analytics skills and build evidence that you can use them.
Is Excel enough to become a Data Analyst?
Excel is enough to begin your data analytics journey, but Excel alone is usually not enough to build a complete Data Analyst skill set.
Think about your current finance work. You might download data, clean it, use formulas, create PivotTables, prepare monthly reports, compare actuals with budgets, and share the results with management.
That is already an analysis.
The gap appears when the data becomes larger or comes from different systems. You may need to query a database instead of manually downloading spreadsheets, combine multiple data sources, create interactive dashboards, or automate repetitive analysis.
That is where the Excel to data analytics journey becomes important.
Modern analytics also involves more than knowing a particular tool. Microsoft’s current Power BI Data Analyst framework, for example, covers preparing, modelling, visualising, analysing, and managing data, along with Power Query and DAX.
So the goal is not to replace Excel. It is to make your existing Excel knowledge part of a broader analytics skill set.
Why is Excel still valuable for finance professionals?
Your Excel experience is not something you need to leave behind when moving into analytics. In fact, it can give you a useful starting point.
As a finance professional, you may already understand:
- Revenue and expense analysis
- Budget versus actual reporting
- Financial forecasting
- Profit and loss statements
- Variance analysis
- Reconciliation
- Monthly and quarterly reporting
- Business KPIs
These are all business problems that involve data.
For example, suppose your current responsibility is preparing a monthly revenue report. You may already know how to clean the spreadsheet, calculate growth, compare regions, and identify variances.
Now imagine adding SQL and Power BI.
Instead of manually preparing the report every month, you could retrieve the required data using SQL and create a Power BI dashboard that allows stakeholders to explore revenue by region, product, month, or customer segment.
The business knowledge stays the same. Your ability to work with the data becomes stronger.
That is the real value of moving from Excel to data analytics.
The first version of Excel was released for the Macintosh in 1985. Windows users got Excel in 1987.
Where does Excel stop being enough?
This is the part many career switchers overlook.
Knowing Excel does not automatically mean you are ready for a Data Analyst role. You need to ask yourself what happens when the job requires you to work outside a spreadsheet.
Can you:
- Query data from a database?
- Join information from multiple tables?
- Clean data from different sources?
- Build a dashboard that updates from a data source?
- Explain why a business metric changed?
- Use statistics to validate your findings?
- Automate repetitive analysis?
If your answer is “not yet” for several of these questions, that does not mean your finance experience is irrelevant. It means you have a skill gap to close.
And that is actually good news. You do not need to become a completely different professional. You need to build the next layer on top of the skills you already have.
The World Economic Forum’s Future of Jobs Report identifies analytical thinking as a leading core skill for employers and says AI, big data, and technology literacy are among the skills increasing in importance.
For someone already working with business data, this makes upskilling a more practical approach than waiting until your current skills become a limitation.
What should you learn after Excel for data analytics?
The biggest mistake you can make during an Excel to data analytics transition is trying to learn everything together.
You do not need five courses, ten tools, and a programming language on day one.
A better progression is:
Excel → SQL → Power BI → Statistics → Python → Projects
1. Learn SQL
SQL is one of the most important skills to add after Excel.
Excel generally starts with data you already have in a spreadsheet. SQL helps you work with data stored in relational databases.
You can use SQL to filter records, group information, calculate metrics, join tables, and answer business questions.
For example:
Which region generated the highest revenue last quarter?
Which customers have contributed the most revenue?
Which departments exceeded their budgets?
Instead of manually preparing separate spreadsheets, SQL can help you retrieve the information you need from structured data.
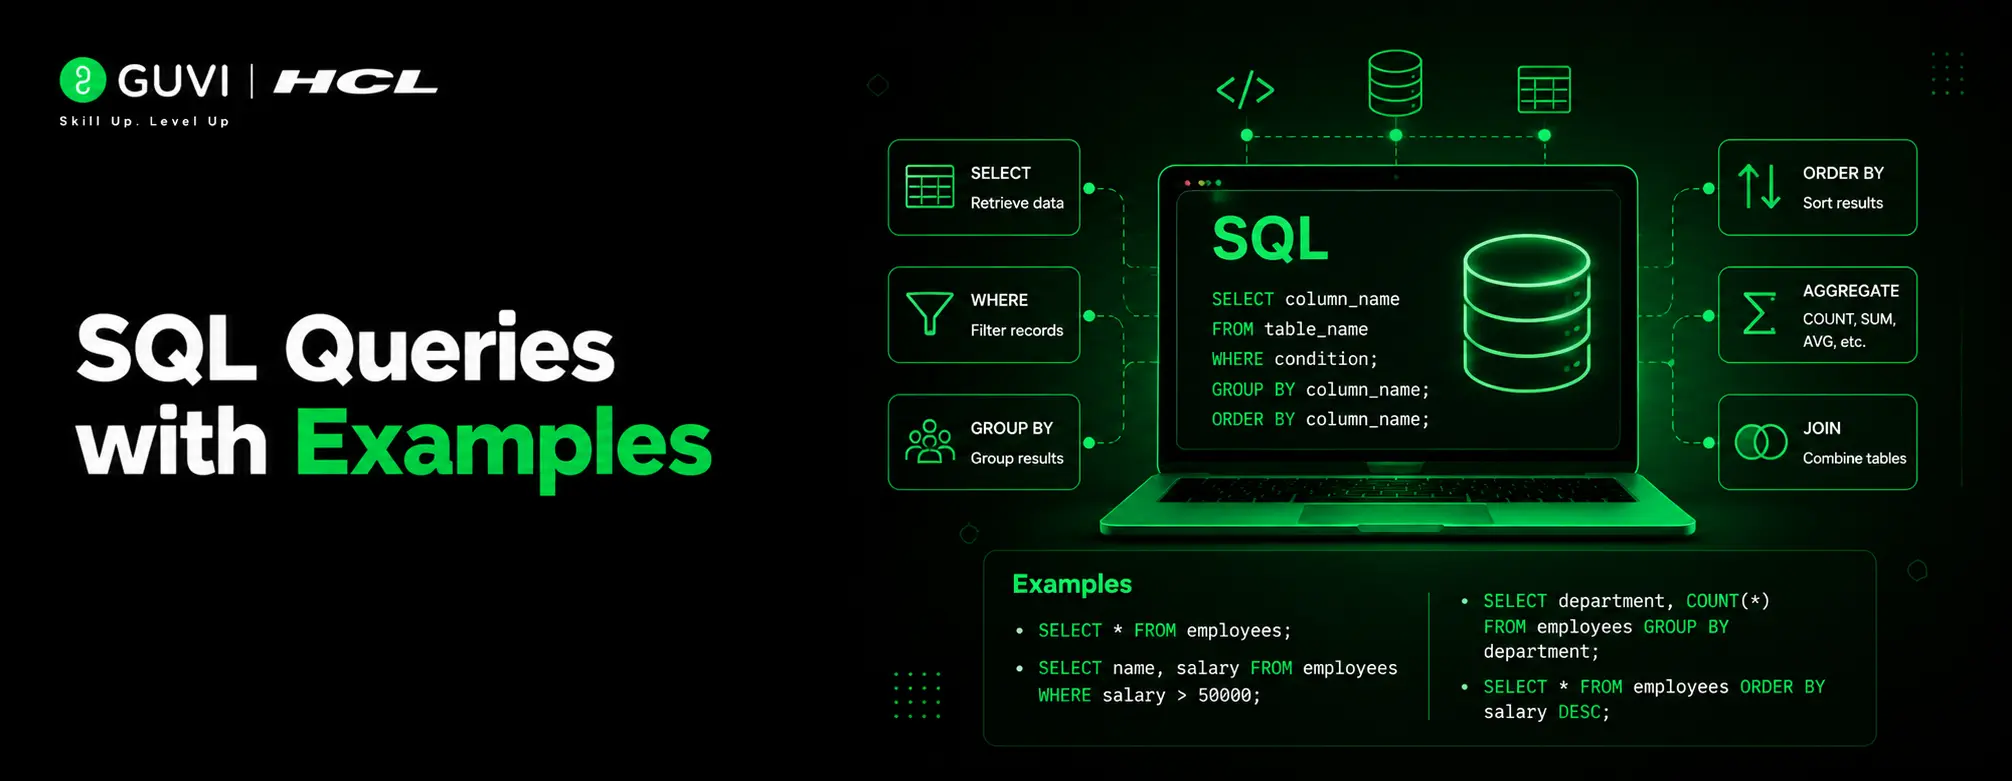
Start with SELECT, WHERE, GROUP BY, ORDER BY, aggregate functions, joins, and subqueries. You do not need advanced SQL immediately.
SQL is older than the internet as we know it. It was developed at IBM in the 1970s and is still one of the most widely used ways to work with databases.
2. Learn Power BI
After SQL, Power BI can help you turn analysis into something business stakeholders can actually use.
Power BI data analysis is around preparing, modelling, visualising, and analysing data. Its learning resources also cover connecting to sources such as Excel and relational databases and cleaning data using Power Query.
For finance professionals, this could mean creating:
- Revenue dashboards
- Expense dashboards
- Budget versus actual reports
- Profitability dashboards
- Financial KPI dashboards
- Sales performance reports
This is also where your finance background becomes valuable.
A dashboard is not useful simply because it has attractive charts. You need to know which numbers matter and what decision the dashboard should support.
3. Strengthen statistics
Statistics helps you move from simply presenting numbers to interpreting them.
You should understand concepts such as:
- Mean and median
- Variance and standard deviation
- Correlation
- Distributions
- Outliers
- Sampling
- Basic probability
- Hypothesis testing
For example, if revenue increased by 20%, a Data Analyst should not stop at reporting the number.
You should be able to investigate what caused the increase, whether it happened across all regions, whether any unusual values affected the result, and what the business should look at next.
4. Add Python when you are ready
Python does not have to be your first step. If you are moving from Excel to data analytics, it can be easier to first understand Excel, SQL, Power BI, and basic statistics.
Once those foundations are clear, Python can help you automate repetitive tasks, analyse larger datasets, perform exploratory analysis, and build more advanced workflows.
The goal is not to become a software developer. The goal is to use Python to solve data problems.

What does an Excel to data analytics roadmap look like?
Here is a practical way to think about the transition:
| Stage | Skill | Your goal |
| 1 | Excel | Clean, analyse and report data |
| 2 | SQL | Query and combine database data |
| 3 | Power BI | Build dashboards and communicate insights |
| 4 | Statistics | Interpret patterns and validate findings |
| 5 | Python | Automate and perform advanced analysis |
| 6 | Projects | Prove you can apply the skills |
The important part is the final stage.
Learning tools is not the same as becoming job-ready.
- If you complete an SQL course but cannot use SQL to answer a business question, you still have work to do.
- If you learn Power BI but only create tutorial dashboards, you still need practice.
Your goal should be to take one business problem and solve it from beginning to end.
What projects should finance professionals build?
This is where your previous experience can become an advantage. Instead of creating random projects, build projects around problems you already understand.
Budget vs actual analysis
Take departmental budget and actual spending data.
Clean the dataset in Excel, query it using SQL, and build a Power BI dashboard showing variance by department, month, and expense category.
Profitability analysis
Analyse revenue, cost, and margin across products or business units.
Your project should answer questions such as:
- Which products generate the highest margin?
- Which products generate high revenue but low profitability?
- How have margins changed over time?
Expense analysis
Create an expense dashboard that identifies spending trends and unusual increases.
This can demonstrate that you understand both the technical side of analytics and the finance context behind the numbers.
Revenue analysis
Build a project that analyses revenue by month, region, product, or customer segment.
Then explain what changed, why it changed, and what a business decision-maker should do next.
That final explanation matters.
A portfolio that shows only charts is weaker than one that shows the question, analysis, insight, and recommendation.
Which roles can you target after moving from Excel to data analytics?
Your next role does not necessarily have to be titled simply “Data Analyst.”
Depending on your existing finance experience and the skills you develop, you can explore roles such as:
- Data Analyst
- Finance Data Analyst
- Reporting Analyst
- Business Analyst
- BI Analyst
- Financial Analyst with analytics responsibilities
- MIS Analyst
- Business Intelligence roles
The exact requirements will vary by company and role. Your previous experience can also help you build a stronger story during interviews.
Instead of saying, “I am a finance professional trying to enter technology,” you can explain:
“I understand finance processes and business reporting. I have now added SQL, Power BI, statistics, and data analysis skills so I can work with data more efficiently and generate deeper business insights.”
That is a much clearer career-transition narrative.
Are you ready to move from Excel to data analytics?
Before you start applying for Data Analyst roles, ask yourself these questions:
| Skill | Can you do it independently? |
| Excel data cleaning | Yes / No |
| PivotTables and advanced formulas | Yes / No |
| SQL queries and joins | Yes / No |
| Power BI dashboards | Yes / No |
| Basic statistics | Yes / No |
| Python for data analysis | Yes / No |
| End-to-end analytics project | Yes / No |
| Explain business insights | Yes / No |
If you are comfortable with Excel but your answers become “No” from SQL onwards, you have identified your next learning path.
You do not need to start over. You need to systematically close the gap.
Why can a structured program help with the Excel to data analytics transition?
You can absolutely learn analytics through self-study. The challenge is knowing what to learn, in what order, and how to practise it.
This becomes even harder when you are already working in finance.
You may learn Excel one week, jump into Python the next, watch Power BI tutorials later, and still not have one complete project to show.
A structured program can solve this by bringing the learning sequence, mentorship, projects, and career preparation into one path.
HCL GUVI’s current AI-Powered Business Analytics Course is positioned around Excel, SQL, Power BI, Tableau, Python, and Generative AI, with hands-on projects and case studies. Its current course page also highlights expert mentorship, placement guidance and mock interviews, and access to 1,000+ hiring partners.
That makes it a more direct fit for someone who is thinking:
“I already know Excel. I need to know what comes next.”
You do not have to learn every tool before starting. What matters is having a clear path from your current skill level to the kind of analytics work you want to do.
Conclusion
The Excel to data analytics journey does not require you to forget everything you already know.
If you are a finance professional, your experience with numbers, reports, budgets, and business decisions is valuable. What you need is a stronger technical layer around that experience.
Start with Excel, add SQL, move into Power BI, strengthen your statistics, and learn Python when you are ready. Then prove those skills through finance-focused projects.
The important thing is not to collect more tools. It is to become capable of taking a business problem, working with the data, finding the insight, and explaining what should happen next.
Excel can be your starting point. It should not have to be your stopping point.
FAQs
1. Is Excel enough to become a Data Analyst?
Excel is a strong starting point, especially for finance professionals, but it is usually not enough by itself. SQL, Power BI, statistics, and project experience can help build a broader Data Analyst skill set.
2. What should I learn after Excel for data analytics?
Start with SQL, then learn Power BI and statistics. Once your foundations are strong, add Python for automation and advanced analysis.
3. Can finance professionals become Data Analysts?
Yes. Finance professionals already understand business numbers, reporting, budgets, costs, and performance metrics. The next step is to add the technical analytics skills required by the roles you want.
4. Do I need coding to move from Excel to data analytics?
You do not need to become a software developer. SQL is usually a more immediate skill for analytics, while Python can be added later depending on your target role.
5. Is Power BI better than Excel for data analytics?
They serve different purposes. Excel remains useful for spreadsheet-based analysis, while Power BI is designed for interactive reporting, data modelling, visualisation, and analysis.
6. How can I prove my data analytics skills?
Build projects that solve realistic business problems. For finance professionals, budget variance, profitability, revenue, expense, and forecasting projects can demonstrate both domain knowledge and analytics skills.
7. Can I move from finance to data analytics without starting over?
Yes. Your finance experience can become part of your advantage. The goal is to combine your existing domain knowledge with SQL, Power BI, statistics, Python, and practical analytics projects.
Success Stories

About the Author
Hashmithaa
Hi, I’m Hashmithaa — a content writer with a love for words. Writing isn’t just what I do; it’s how I connect, communicate, and create meaning in a noisy digital world. And if my words help someone make a better decision, learn something new, or feel more confident, then I’ve done my job well.
View all posts by Hashmithaa
Connect with me @







Did you enjoy this article?