


Data Science Articles
Accountant vs Data Analyst Salary in India After Switching Careers - Best Guide
Finance Managers: Could Data Science Be Your Next Career Move?
Insurance Claims Executive to Data Analyst: Is It a Good Switch?
Banking Executive (Loans, KYC) to Data Analyst: Skills and Career Path


Get In Touch For Details! Request More Information
Hypothesis Testing in Data Science: 2026 Beginner’s Guide With Tests, Steps & Examples
Oct 13, 2026 9 Min Read 14059 Views
(Last Updated)
Hypothesis testing in data science is a statistical method that uses sample data to decide whether a claim about a larger population is likely true or just due to chance. You start with an assumption, such as “this change has no effect,” and then check whether your data gives enough evidence to reject it.
It matters because real data is noisy. A jump in sales or a better model score can look convincing and still be random variation. Hypothesis testing gives you a clear, repeatable way to distinguish a real pattern from a lucky one before you act.
Table of contents
- TL;DR Summary
- What is Hypothesis Testing in Data Science?
- Definition
- How is Hypothesis Testing Used in Data Science?
- When to Use Hypothesis Testing in Data Science?
- Examples and Applications
- Common Hypothesis Tests in Data Science Compared
- Types of Hypothesis
- Null Hypothesis
- Alternative Hypothesis
- Non-directional Hypothesis
- Directional Hypothesis
- Statistical Hypothesis
- Complete Guide to Hypothesis Testing in Data Science in India 2026
- How to Calculate Hypothesis Testing?
- Step 1: Formulate the Hypotheses
- Step 2: Choose the Significance Level
- Step 3: Collect and Analyze Data
- Step 4: Calculate the Test Statistic
- Step 5: Compare the Test Statistic
- Step 6: Interpret the Results
- Table: Decision Making in Hypothesis Testing
- Must-Know Terminology for Hypothesis Testing
- Parameter
- Statistics
- Sampling Distribution
- Standard Error
- Type I Error
- Type-II Error
- The Level of Significance
- P-value
- Table: Key Hypothesis Testing Terms and Definitions
- Hypothesis Testing Interview Questions and Answers for Data Science Roles
- Conclusion
- FAQs
- What is hypothesis testing in data science?
- What are the steps of hypothesis testing in data science?
- What is the difference between the null and alternative hypothesis?
- What is a p-value in hypothesis testing?
- What is the difference between a Type I and a Type II error?
TL;DR Summary
- This blog covers hypothesis testing in data science, from what it means and how it is used to when you should apply it, with real-world examples.
- It helps you compare common tests like the Z-test, t-test, chi-square, ANOVA and Mann-Whitney U, so you can pick the right one for your data.
- It guides you through the six steps of running a hypothesis test, with a worked example and Python code along the way.
- It also explores the different types of hypotheses and key terms such as the p-value, significance level and Type I and Type II errors.
- It rounds off with common interview questions and answers for data science roles.
Hypothesis testing began in the 1920s when Ronald Fisher tested Muriel Bristol’s claim that she could taste whether milk or tea was poured first. Using 8 cups, Fisher demonstrated that guessing all the cups correctly by chance had just a 1 in 70 probability.
What is Hypothesis Testing in Data Science?
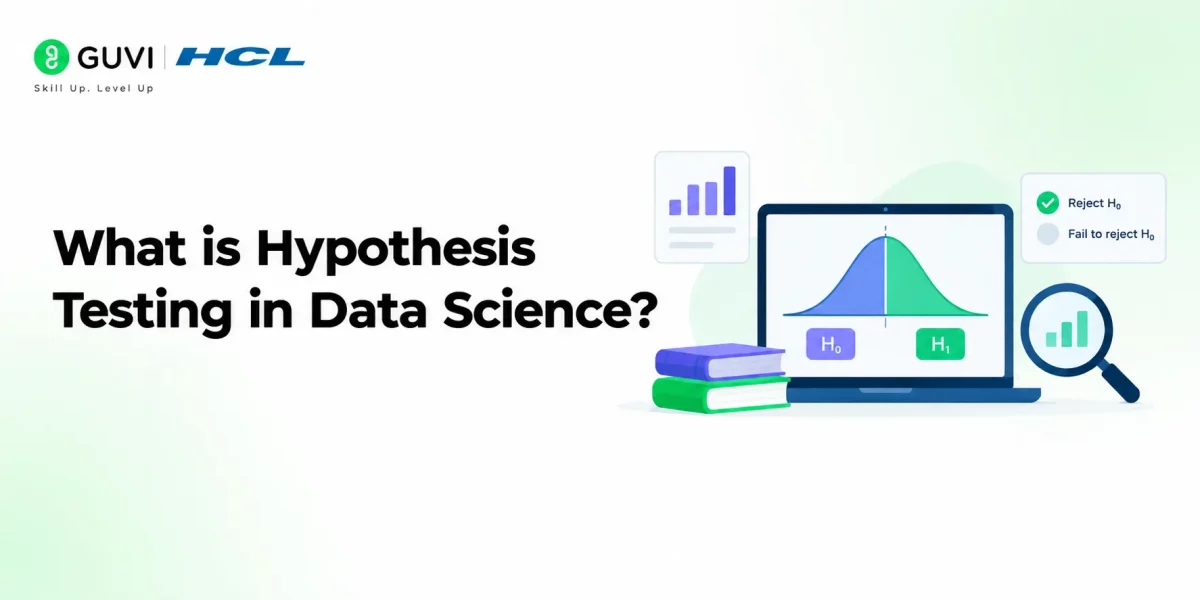
Hypothesis testing in data science is a fundamental statistical procedure that determines whether a data sample provides enough evidence to infer a specific condition about a population. This method is crucial in data science for validating theories and models about data behaviors.
Definition
At its core, hypothesis testing in data science involves two contrasting hypotheses: the null hypothesis, which states that there is no effect or difference, and the alternative hypothesis, which you aim to support.
Through hypothesis testing, you can determine whether the observed data deviates significantly from the null hypothesis, thereby supporting the alternative hypothesis.
How is Hypothesis Testing Used in Data Science?
In data science, hypothesis testing helps inform decisions and predictions based on data analysis.
For instance, it can determine whether a new drug is more effective than the current standard or whether changes to a website’s layout increase conversions.
It’s used to compare the means of two data groups, test proportions in categorical data, or determine the correlation between variables.
When to Use Hypothesis Testing in Data Science?
You should use hypothesis testing when making assertions about a data population based on sample data. This is particularly useful in scenarios such as:
- Comparing a single group against a pre-established standard.
- Assessing the differences between two or more groups.
Hypothesis testing can be divided into parametric and non-parametric tests.
- Parametric tests assume a normal distribution, such as when testing whether a group’s average height differs from a specific value.
- Non-parametric tests, on the other hand, do not assume a normal distribution and are useful when data do not meet this criterion, such as income distributions across demographic groups.
Table: Types of Hypothesis Tests and Their Applications
| Type of Test | Description | Common Use Cases |
|---|---|---|
| Parametric | Assumes data follows a normal distribution. | Comparing means, testing correlations. |
| Non-parametric | Does not assume a normal distribution. | Data with skewed distributions, ordinal data. |
Examples and Applications
Consider the following examples to understand the application of hypothesis testing in real-world scenarios:
- Hypothesis 1: Testing if the average order value has increased since the last financial year using a one-sample parametric test.
- Hypothesis 2: Comparing investment returns between two stocks using a two-sample parametric test.
- Hypothesis 3: Evaluate whether a new user interface leads to a higher conversion rate than the expected 30% using a one-sample nonparametric test.
These examples show how hypothesis testing supports informed decision-making in business and research contexts.
By understanding and applying hypothesis testing effectively, you can make better data-driven decisions in data science.
Six months from now, you could be the one turning raw data into decisions. Join HCL GUVI’s Advanced Data Science & Generative AI and go from Python basics to Machine Learning and Generative AI with live classes, 1:1 mentor support and 10+ real-world projects. No coding background needed. Earn an IITM Pravartak certification and get placement support with mock interviews, resume reviews, and access to 1000+ hiring partners. Enroll today and start building your data science career!
Common Hypothesis Tests in Data Science Compared
Choosing the right test depends on the data type, number of groups, and assumptions involved:
| Test | Best Used For | Data Type | Example |
|---|---|---|---|
| Z-test | Comparing means when population variance is known | Numerical | Compare average order value with a benchmark |
| T-test | Comparing means when population variance is unknown | Numerical | Compare conversion values between two groups |
| Chi-square Test | Testing relationships between categorical variables | Categorical | Check whether device type affects purchase behavior |
| ANOVA | Comparing means across three or more groups | Numerical | Compare sales across multiple campaigns |
| Mann-Whitney U Test | Comparing two independent groups without assuming normality | Ordinal/Non-normal numerical | Compare skewed customer spending data |
Types of Hypothesis
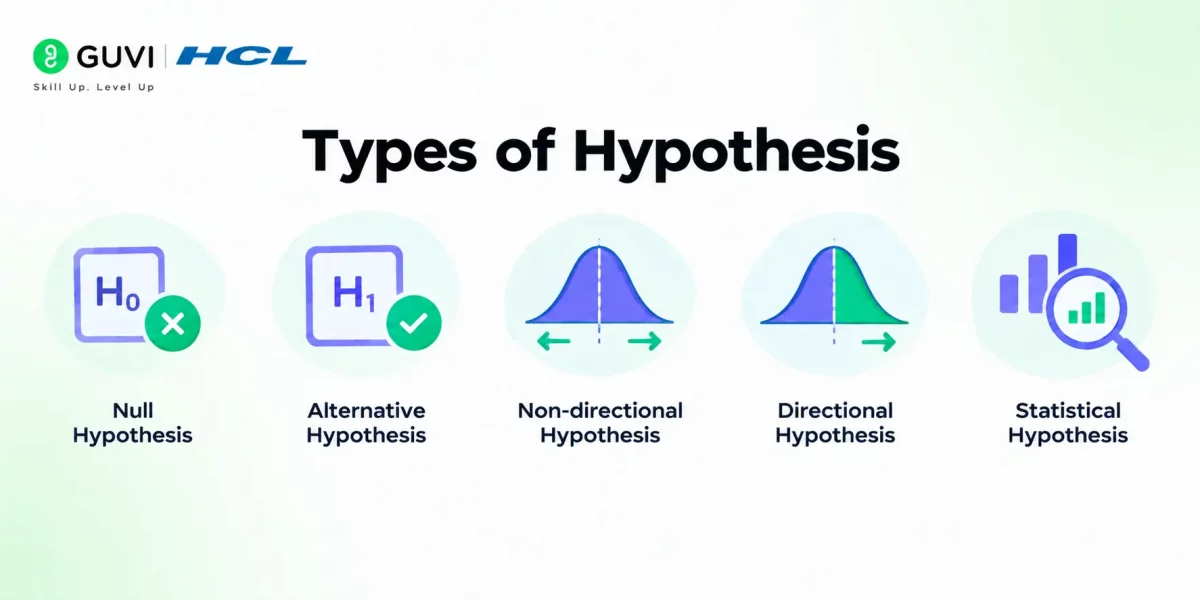
1. Null Hypothesis
The null hypothesis, denoted as H0, proposes no statistical significance or effect between the variables under study. It serves as the default position in hypothesis testing, suggesting that any observed differences are due to chance.
For example, if you’re testing the effectiveness of a new teaching method, the null hypothesis would state that this method does not affect a student’s performance compared to the conventional approach.
2. Alternative Hypothesis
Contrary to the null hypothesis, the alternative hypothesis, denoted as Ha or H1, asserts that the variables are significantly related.
Researchers aim to support it through their data analysis. For instance, in the teaching-method example, the alternative hypothesis would suggest that the new method significantly improves student performance.
3. Non-directional Hypothesis
A non-directional hypothesis does not specify the direction of the expected effect or relationship. It predicts a difference or relationship without stating whether it will be positive or negative.
This type of hypothesis suits situations where the outcome direction is unknown beforehand, allowing open-ended exploration of the data.
4. Directional Hypothesis
In contrast, a directional hypothesis specifies the expected direction of the relationship or effect between variables. It might predict, for example, that one group will score higher or lower than another based on some intervention.
Use this hypothesis when prior research or theory suggests a particular outcome direction.
5. Statistical Hypothesis
Statistical hypotheses let you infer about a population from sample data. These include both the null and alternative hypotheses.
Statistical hypothesis testing involves calculating the probability of observing the sample data if the null hypothesis is true. This process helps you decide whether to accept or reject the null hypothesis based on the evidence in the data.
Complete Guide to Hypothesis Testing in Data Science in India 2026
For data science students and beginners in India, hypothesis testing is an important statistical skill used in A/B testing, experimentation, business analytics, model evaluation, and research.
It helps determine whether an observed difference or relationship in data is statistically meaningful or could have occurred by chance.
This makes hypothesis testing useful in many practical situations. A data scientist may use it to check whether a new website design improves conversions, whether two customer groups behave differently, or whether a business strategy produces measurable results.
The essential concepts to learn are:
- Null and alternative hypotheses
- Significance level
- P-value
- Test statistic
- Type I and Type II errors
- T-tests and Z-tests
- Chi-square tests
- ANOVA
- Parametric vs. non-parametric testing
A good learning approach is to first understand how hypotheses are framed and how statistical significance is measured. Then move on to selecting the right test based on the data type, sample size, number of groups, and distribution.
Practical application is equally important. Students can use real or sample datasets to compare means, test proportions, examine relationships between variables, and evaluate experimental results.
Python remains a practical way to apply these concepts. In 2026, the current ecosystem includes Python 3.14.7, pandas 3.0.5, NumPy 2.4.6, and SciPy 1.18.0. Pandas and NumPy help prepare and manipulate data, while SciPy’s stats module provides functions for performing common statistical and hypothesis tests.
By combining statistical theory with Python-based practice, beginners can build a stronger foundation for data analysis, experimentation, and data-driven decision-making.
How to Calculate Hypothesis Testing?
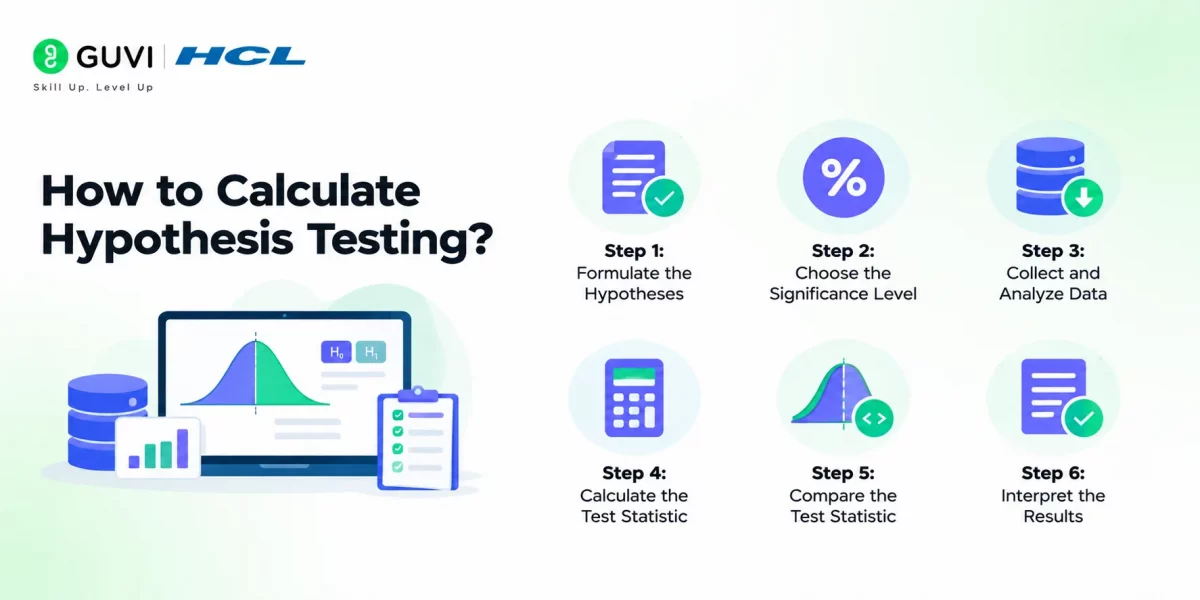
Hypothesis testing is a structured process that determines whether the data support a hypothesis about a population parameter.
Here’s a step-by-step breakdown of how you can perform hypothesis testing in your data science projects:
Step 1: Formulate the Hypotheses
Start by stating two competing claims. The null hypothesis (H0) says there is no effect or no difference. The alternative hypothesis (H1) says there is an effect or a difference.
Example: A class has historically averaged 70 marks. You teach ten students with a new method and want to know whether it changes that average.
- H0: μ = 70 (the new method has no impact on performance)
- H1: μ ≠ 70 (the new method does have an impact)
Step 2: Choose the Significance Level
Choose a significance level (α), usually 0.05. This is the threshold for rejecting the null hypothesis. It also tells you how much Type I error risk you accept, meaning rejecting H0 when it is actually true. At α = 0.05, that risk is 5%.
Example: We use α = 0.05. Our H1 says “not equal”, so the test is two-tailed, and the 5% is split into 2.5% on each end of the distribution.
alpha = 0.05
alpha_per_tail = alpha / 2

print(alpha, alpha_per_tail)
# 0.05 0.025
Code Explanation:
alphastores our significance level so we can reuse it in later steps.alpha_per_tailis half of alpha, because a two-tailed test checks both ends.- A one-tailed test would use the full 0.05 on a single side.
Step 3: Collect and Analyze Data
Gather data through observation or experiment. Then summarize it, because the test statistic is built from these summary numbers.
Example: The ten students taught with the new method score 72, 75, 68, 80, 77, 74, 71, 79, 73 and 76. Their sample mean is 74.5, and the sample standard deviation is 3.69.
import numpy as np

scores = [72, 75, 68, 80, 77, 74, 71, 79, 73, 76]

n = len(scores)
sample_mean = np.mean(scores)
sample_std = np.std(scores, ddof=1)

print(f"n = {n}, mean = {sample_mean:.2f}, std = {sample_std:.2f}")
# n = 10, mean = 74.50, std = 3.69
Code Explanation:
scoresholds the raw marks of the ten students.np.meangives the sample mean.ddof=1tells NumPy to calculate the sample standard deviation (dividing by n – 1), not the population one.- We will reuse
scoresin the next steps.
Step 4: Calculate the Test Statistic
The right test depends on your data and your question. The common options are:
- Z-test: Used when the population standard deviation is known, and the sample is large.
- T-test: Used when the population standard deviation is unknown, especially with small samples.
- Chi-square test: Used for categorical data, such as testing independence in a contingency table.
- F-test (ANOVA): Used to compare means across three or more groups by comparing the variance between groups with the variance within groups.
Table: Summary of Test Statistics and Their Usage
| Test Type | When to Use | Test Statistic Formula |
|---|---|---|
| Z-test | Known population standard deviation, large sample | Z = (X̄ – μ) / (σ/√n) |
| T-test | Unknown σ, usually a small sample | t = (X̄ – μ) / (s/√n) |
| Chi-square | Categorical data | χ² = Σ [(O – E)² / E] |
| F-test | Comparing means of 3+ groups | F = Variance between groups / Variance within groups |
Example: In our class, the population standard deviation is unknown and the sample has only 10 students, so the t-test is the right choice.
- t = (74.5 – 70) / (3.69 / √10) = 3.86
from scipy import stats

# continuing from Step 3, where `scores` is already defined
t_stat, p_value = stats.ttest_1samp(scores, popmean=70)

print(f"t = {t_stat:.2f}, p-value = {p_value:.4f}")
# t = 3.86, p-value = 0.0039
Code Explanation:
ttest_1sampcompares the sample mean againstpopmean=70in a single call.- It returns the t_stat and a two-tailed p-value.
- We keep
t_statandp_valuebecause Steps 5 and 6 use them. - The other tests follow the same pattern:
chi2_contingencyfor chi-square andf_onewayfor ANOVA, both fromscipy.stats. - SciPy has no one-line Z-test, so you can apply the Z formula directly and get the p-value with
norm.cdf.

Step 5: Compare the Test Statistic
You can make the call in two ways, and both lead to the same decision.
- Method A (critical values): If your test statistic falls beyond the critical value, reject the null hypothesis. If it does not, fail to reject it.
- Method B (p-values): If the p-value is less than or equal to α, reject the null hypothesis. If it is greater, fail to reject it.
Example: Back to our class. With 9 degrees of freedom and α = 0.05 (two-tailed), the critical value is ±2.262. Our t_stat is 3.86, which exceeds this value. Our p-value is 0.0039, which is below 0.05. Both methods agree.
# continuing from Steps 2 to 4
critical = stats.t.ppf(1 - alpha / 2, df=len(scores) - 1)

print(f"Critical value = ±{critical:.3f}")
print("Method A, |t| > critical:", abs(t_stat) > critical)
print("Method B, p-value <= alpha:", p_value <= alpha)
# Critical value = ±2.262
# Method A, |t| > critical: True
# Method B, p-value <= alpha: True
Code Explanation:
stats.t.ppfreturns the critical value. We pass1 - alpha / 2because each tail holds 2.5%.dfis the degrees of freedom, which is n – 1 for a one-sample t-test.- We use
abs(t_stat)so the check works for both tails. - Both checks print
True, which means both methods point to rejecting H0.
Step 6: Interpret the Results
Finally, turn the numbers into a plain-language conclusion. If the test statistic crosses the critical value, or the p-value is below α, reject the null hypothesis. Otherwise, you fail to reject it, meaning you do not have enough evidence to support the alternative hypothesis.
Table: Decision Making in Hypothesis Testing
| Decision Criteria | Action Taken |
|---|---|
| Test statistic beyond the critical value | Reject H0 |
| P-value ≤ significance level (α) | Reject H0 |
| Test statistic within the critical value | Fail to reject H0 |
| P-value > significance level (α) | Fail to reject H0 |
Example: In our class, the p-value (0.0039) is below α (0.05), so we reject H0. The new teaching method is linked to a significant change in average marks. The sample mean of 74.5 is higher than 70, so the change improves average marks.
# continuing from Step 5
if p_value <= alpha:
    print("Reject H0: the new method changes the average score.")
else:
    print("Fail to reject H0: not enough evidence of a change.")
# Reject H0: the new method changes the average score.
Code Explanation:
- The
ifstatement applies the decision rule from the table above. - It compares the p-value with alpha, so the logic stays the same for any test.
- Rejecting H0 does not prove H1 beyond doubt. It only says the data is very unlikely under H0.
By following these steps, you can systematically assess the validity of hypotheses in your data science projects, ensuring that your conclusions are backed by rigorous statistical evidence.
Must-Know Terminology for Hypothesis Testing
Let us understand some of the basic terminology that data scientists know about hypothesis testing:
1. Parameter
A parameter in statistics is a fixed value that describes a population characteristic.
For example, the mean income of an entire country is a parameter because it describes a population characteristic.
2. Statistics
A statistic, on the other hand, describes a sample characteristic, a characteristic of a subset of the population.
It is used to estimate the corresponding parameter. For instance, the average income of a sample of individuals from a city would be a statistic used to estimate the population parameter.
3. Sampling Distribution
The sampling distribution is the probability distribution of a statistic obtained by repeatedly sampling from a population.
It shows how the statistic varies and lets you calculate probabilities, improving the reliability of inferences from samples.
4. Standard Error
Standard error measures how much a sample statistic varies from the population parameter. It is calculated as the standard deviation of the sampling distribution and is crucial for constructing confidence intervals and conducting hypothesis tests.
5. Type I Error
A Type I error occurs when you incorrectly reject the null hypothesis when it is actually true. This error is also known as a “false positive” and is directly related to the significance level (alpha, α), which you set before testing.
6. Type-II Error
Conversely, a Type-II error occurs when you fail to reject a false null hypothesis, meaning you incorrectly accept it. This “false negative” error is inversely related to the test’s power, which reflects the test’s ability to correctly reject a false null hypothesis.
7. The Level of Significance
The level of significance (denoted as alpha, α) is the threshold probability for rejecting the null hypothesis. It defines the likelihood of observing the sample data if the null hypothesis is true. Commonly set at 0.05, it represents a 5% risk of committing a Type I error.
8. P-value
The p-value quantifies the probability of obtaining a test statistic at least as extreme as the one observed, assuming the null hypothesis is correct. A p-value below the significance level indicates strong evidence against the null hypothesis, leading to rejection.
Table: Key Hypothesis Testing Terms and Definitions
| Term | Definition |
|---|---|
| Parameter | A fixed value describing a population characteristic. |
| Statistic | A value describing a sample characteristic, used to estimate the population parameter. |
| Sampling Distribution | Probability distribution of a statistic obtained from repeated sampling. |
| Standard Error | Measures the variability of a sample statistic from the population parameter. |
| Type-I Error | False positive; incorrect rejection of a true null hypothesis. |
| Type-II Error | False negative; failure to reject a false null hypothesis. |
| Level of Significance | Probability threshold for rejecting the null hypothesis. |
| P-value | Probability of observing the test statistic, assuming the null hypothesis is true. |
By familiarizing yourself with these terms, you enhance your understanding of hypothesis testing, allowing for more accurate and reliable data analysis in your projects.
Hypothesis Testing Interview Questions and Answers for Data Science Roles
Here are the hypothesis testing interview questions that data science candidates are most often asked:
1. What is a p-value, and what does it not tell you?
The p-value is the probability of getting results at least as extreme as yours if the null hypothesis is true. It does not tell you the probability that H0 is true, and it does not measure the size or importance of an effect.
2. What is the difference between a Type I and a Type II error? Which is worse?
A Type I error is a false positive: rejecting H0 when it is true, with probability α. A Type II error is a false negative: failing to reject H0 when it is false, with probability β. Neither is always worse. Missing a disease (Type II) is costly in medicine, while launching a useless feature (Type I) is costly in product work.
3. When do you use a z-test and when do you use a t-test?
Use a z-test when the population standard deviation is known, and the sample is large. Use a t-test when it is unknown, which is almost always the case in real projects. For large samples, the two give nearly identical results.
4. Why do we say “fail to reject H0” instead of “accept H0”?
Because a test can only show that the data are inconsistent with H0, not that H0 is true. A non-significant result may simply mean the sample was too small to detect a real effect.
5. When should you use a one-tailed test instead of a two-tailed test?
Use a one-tailed test only when you decide the direction in advance, and an effect in the opposite direction wouldn’t matter. Otherwise, use a two-tailed test. Switching to a one-tailed test after seeing the data to get a lower p-value is cheating.
6. What is the difference between statistical significance and practical significance?
Statistical significance means the effect is unlikely to be due to chance. Practical significance means the effect is big enough to matter. With a huge sample, even a tiny, useless difference can produce a very small p-value, so you should always report the effect size and a confidence interval too.
7. What is the power of a test, and what affects it?
Power is the probability of detecting a real effect (1 – β), and 80% is a common target. It increases with a larger sample size, a larger true effect, a higher α, and lower data variability.
8. What is the multiple testing problem?
If you run many tests, some will look significant by chance. At α = 0.05, 20 tests will produce about one false positive on average. You can control this with a Bonferroni correction (divide α by the number of tests) or by controlling the false discovery rate.
9. What assumptions does a t-test make, and what do you do if they are violated?
It assumes independent observations, roughly normal data and, for the standard two-sample version, equal variances in both groups. If the variances differ, use Welch’s t-test. If the data is clearly non-normal and the sample is small, use a non-parametric test such as the Mann-Whitney U test.
10. You ran an A/B test on a checkout page. How do you test whether the new version converts better?
Conversion is a proportion, so a two-proportion z-test (or a chi-square test) is the usual choice. Decide the sample size before the test using a power analysis, and don’t stop early just because the p-value dips below 0.05. Checking repeatedly and stopping at the first significant result inflates false positives.
Conclusion
Hypothesis testing in data science helps teams make evidence-based decisions instead of relying on assumptions. Because it works with samples, its results always carry some uncertainty, which is why it is such an important part of any data analysis or experiment. It gives data teams a clear way to judge whether a result is real or just chance.
FAQs
1. What is hypothesis testing in data science?
It is a statistical method that uses sample data to decide whether a claim about a population is supported or just due to chance.
2. What are the steps of hypothesis testing in data science?
Formulate the hypotheses, choose the significance level, collect data, calculate the test statistic, compare it with the critical value or p-value, and interpret the result.
3. What is the difference between the null and alternative hypothesis?
The null hypothesis states there is no effect or difference, while the alternative hypothesis states there is.
4. What is a p-value in hypothesis testing?
It is the probability of getting a result at least as extreme as yours if the null hypothesis is true.
5. What is the difference between a Type I and a Type II error?
A Type I error is rejecting a true null hypothesis (false positive), and a Type II error is failing to reject a false one (false negative).
Success Stories














Did you enjoy this article?