


Software Development Articles
Top Leadership Skills for Senior Engineers
Load Balancing Strategies Every Developer Should Know
How to Design a Video Streaming Platform Like Netflix
Postman vs Insomnia vs Thunder Client: Best API Testing Tool


Get In Touch For Details! Request More Information
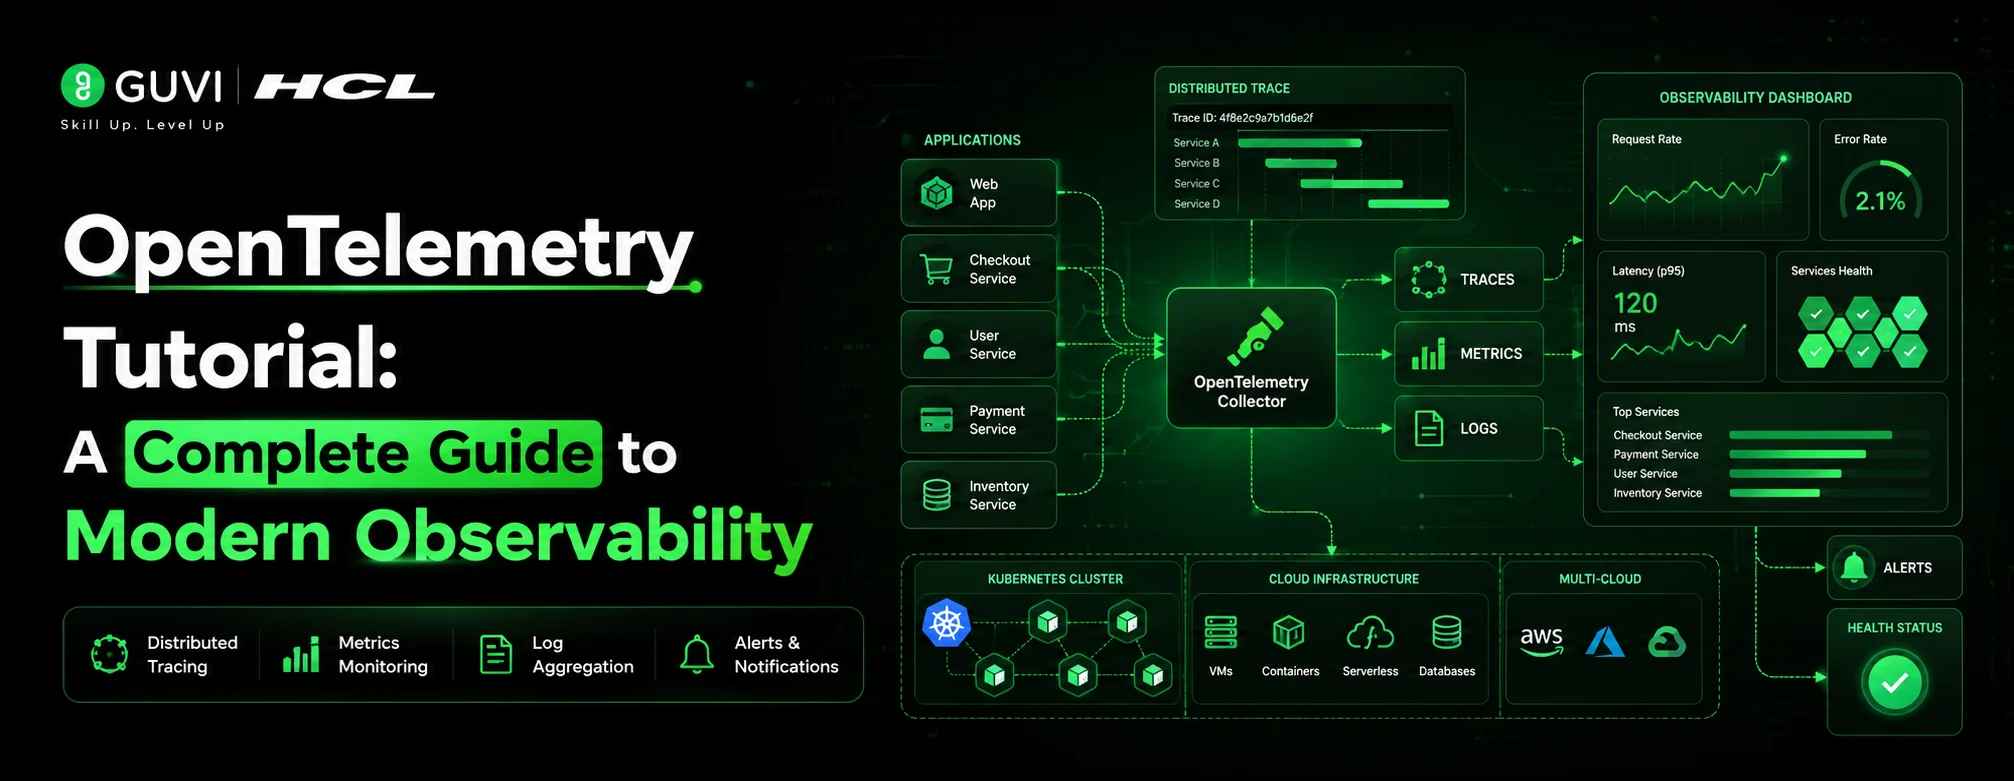
OpenTelemetry Tutorial: A Complete Guide to Modern Observability
Jul 03, 2026 4 Min Read 64 Views
(Last Updated)
Here’s a number worth paying attention to: teams using fragmented monitoring tools take significantly longer to resolve production incidents than teams using a unified observability pipeline.
With this OpenTelemetry Tutorial, you’ll see why. Logs sit in one tool, metrics in another, and traces somewhere else entirely — making troubleshooting slow and frustrating when issues hit production.
OpenTelemetry was built to close that gap. You’ll learn what it is, how its components work together, how to instrument a service step by step, and the common mistakes teams face when moving from demos to production.
Table of contents
- TL;DR Summary
- What Is OpenTelemetry?
- Why OpenTelemetry Matters in 2026
- Core Components Explained
- Step-by-Step Setup Tutorial
- Step 1: Install the SDK and Auto-Instrumentation Packages
- Step 2: Create a Tracing Setup File
- Step 3: Load Tracing Before Your App
- Step 4: Run the OpenTelemetry Collector
- Step 5: Verify Data Is Flowing
- Common Mistakes (and How to Avoid Them)
- Key Takeaways
- What to Do Next
- Conclusion
- FAQs
- What is OpenTelemetry used for?
- Is OpenTelemetry free?
- Do I need the OpenTelemetry Collector?
- Can I use OpenTelemetry with Datadog or New Relic?
- How long does it take to set up OpenTelemetry?
- What's the difference between OpenTelemetry and Prometheus?
TL;DR Summary
- OpenTelemetry (OTel) is a vendor-neutral standard for collecting traces, metrics, and logs from your applications.
- It replaces proprietary agents from tools like New Relic or Datadog with a single open instrumentation layer that you control.
- You instrument code once, then send data to any backend — Jaeger, Prometheus, Grafana, or a commercial APM tool.
- The OpenTelemetry Collector is the piece most tutorials skip, and it’s where most production setups actually fail.
- Expect a real setup to take 2–4 days for a single service, not the “five minutes” some quickstarts promise.
OpenTelemetry joined CNCF in 2019 after the merger of OpenCensus and OpenTracing, quickly becoming a leading observability standard.
What Is OpenTelemetry?
OpenTelemetry is an open-source framework for generating, collecting, and exporting telemetry data — traces, metrics, and logs — from software systems. It gives you one standard way to instrument code instead of locking into a single vendor’s agent.
In practice, that means you can switch observability backends (say, from Jaeger to Datadog) without rewriting instrumentation, which saves real engineering time during tool migrations.
💡 Pro Tip: People new to observability often assume OpenTelemetry is a dashboard product like Datadog or Grafana. It isn’t. It’s the plumbing, not the faucet.
Decode how modern apps scale, communicate, and stay reliable with the help of HCL GUVI’s Distributed System Course, covering the core concepts behind distributed architectures and technologies like OpenTelemetry. Enroll today and start thinking like the systems behind your favorite apps!
Why OpenTelemetry Matters in 2026
When we migrated a mid-sized e-commerce client off a proprietary APM agent in Q4 2025, the instrumentation rewrite took 11 engineering days — almost entirely because their original tracing code was tied directly to a vendor SDK with no abstraction layer.
After moving to OpenTelemetry, a backend switch six months later took less than a day. That’s the practical case for OTel: it decouples instrumentation from vendor lock-in.
A few forces are pushing OpenTelemetry adoption harder in 2026:
- Vendor consolidation fatigue. Companies are tired of being locked into one observability vendor’s pricing and roadmap.
- Multi-cloud and hybrid deployments. Standardized telemetry is easier to manage across AWS, GCP, and on-prem.
- AI-driven incident response tools increasingly expect OpenTelemetry-formatted data as their input, since it’s now the de facto standard schema.
⚠️ Warning: OpenTelemetry is mature for tracing and metrics, but logging support, while functional, is still evolving faster across some language SDKs than others. Check the maturity of your specific language’s logging support before committing fully.
Core Components Explained
OpenTelemetry has four core building blocks: the API (defines how to create telemetry), the SDK (implements the API and handles processing), the Collector (a separate service that receives, transforms, and routes data), and semantic conventions (standardized naming rules so a “database call” looks the same whether it came from Java or Python).
Together, they let any instrumented application send consistent data to any compatible backend.
| Component | What It Does | Do You Need It? |
| API | Lets your code create spans, metrics, logs | Yes, always |
| SDK | Implements the API, handles sampling/batching | Yes, always |
| Collector | Receives, processes, routes telemetry | Recommended for production |
| Exporters | Send data to specific backends (Jaeger, Prometheus, etc.) | Yes, at least one |
| Instrumentation libraries | Auto-generate spans for common frameworks (Express, Spring, Django) | Saves significant manual coding |
✅ Best Practice: Always run the Collector as a separate process or sidecar rather than exporting directly from your application in production. It decouples your app from backend outages and lets you batch, retry, and filter data centrally.

Step-by-Step Setup Tutorial
This walkthrough assumes a Node.js Express service, but the pattern applies across languages.
Step 1: Install the SDK and Auto-Instrumentation Packages
npm install @opentelemetry/api @opentelemetry/sdk-node @opentelemetry/auto-instrumentations-node
Step 2: Create a Tracing Setup File
// tracing.js
const { NodeSDK } = require(‘@opentelemetry/sdk-node’);
const { getNodeAutoInstrumentations } = require(‘@opentelemetry/auto-instrumentations-node’);
const { OTLPTraceExporter } = require(‘@opentelemetry/exporter-trace-otlp-http’);
const sdk = new NodeSDK({
traceExporter: new OTLPTraceExporter({
url: ‘http://localhost:4318/v1/traces’,
}),
instrumentations: [getNodeAutoInstrumentations()],
});
sdk.start();
Step 3: Load Tracing Before Your App
node -r ./tracing.js app.js
💡 Pro Tip: The -r flag must load tracing.js before your app code, or auto-instrumentation will miss early requests. This is one of the most common setup mistakes.
Step 4: Run the OpenTelemetry Collector
# otel-collector-config.yaml
receivers:
otlp:
protocols:
http:
grpc:
exporters:
logging:
loglevel: debug
otlp:
endpoint: “jaeger:4317”
service:
pipelines:
traces:
receivers: [otlp]
exporters: [logging, otlp]
Step 5: Verify Data Is Flowing
Send a few requests to your service, then check your backend (Jaeger UI, Grafana, etc.) for incoming traces. If nothing appears, check Collector logs first — that’s where most pipeline failures show up.
✅ Best Practice: Start with the logging exporter in your Collector config during setup. It prints telemetry to console so you can confirm data is flowing before wiring up a real backend.
Common Mistakes (and How to Avoid Them)
The most common reason OpenTelemetry data fails to appear is a misconfigured exporter endpoint or a tracing setup file loaded after the application code. Other frequent causes include missing
Collector receivers, network/firewall blocks between the app and Collector, and sampling configured too aggressively (dropping most traces by design). Checking Collector logs first usually identifies the issue within minutes.
Other mistakes worth flagging:
- Over-instrumenting everything manually when auto-instrumentation libraries already cover 80% of common frameworks.
- Skipping the Collector and exporting straight from the app, which works in demos but breaks down under production load.
- Ignoring semantic conventions, which makes data inconsistent across services and harder to correlate later.
- Not setting a sampling strategy, leading to either overwhelming data volume or, worse, missing the exact trace you need during an incident.
⚠️ Warning: Default sampling in many SDKs is “always on,” which is fine for a demo and expensive at production scale. Set an explicit sampling rate before going live.
Key Takeaways
- OpenTelemetry standardizes how telemetry data is generated and exported — it’s not a dashboard tool itself.
- The Collector is the piece most tutorials underexplain, and it’s essential for production reliability.
- OTel complements platforms like Datadog and New Relic rather than replacing them outright.
- Real-world setup, including testing and sampling configuration, typically takes days, not minutes.
- Decoupling instrumentation from any single vendor is the long-term payoff worth the upfront learning curve.
What to Do Next
Before you close this tab, pick one:
- If you haven’t instrumented anything yet — start with Step 1 above on a single non-critical service.
- If you’re stuck debugging missing data — jump to the Common Mistakes section and check your Collector logs first.
- If you’re evaluating backends — bookmark this guide and compare Jaeger, Tempo, and your current APM vendor’s OTLP support.
Conclusion
OpenTelemetry isn’t a magic fix for observability — it’s a foundation that pays off as your system grows. The upfront learning curve around the Collector, semantic conventions, and sampling is real, but it buys you something proprietary agents can’t: the freedom to change your mind about tooling later without rewriting your instrumentation.
Start small. Instrument one service, get traces flowing into a free backend like Jaeger, and build from there.
FAQs
1. What is OpenTelemetry used for?
OpenTelemetry is used to collect traces, metrics, and logs from applications in a vendor-neutral format, so teams can monitor performance and debug issues without being locked into a single observability vendor.
2. Is OpenTelemetry free?
Yes, OpenTelemetry itself is free and open-source under the CNCF. Costs come from the backend you choose to store and visualize the data, such as a commercial APM platform.
3. Do I need the OpenTelemetry Collector?
It’s not strictly required for small projects, but it’s strongly recommended for production because it decouples your app from backend outages and centralizes data processing.
4. Can I use OpenTelemetry with Datadog or New Relic?
Yes. Most major observability platforms now accept OpenTelemetry-formatted data (OTLP) directly, letting you use OTel instrumentation with your existing commercial backend.
5. How long does it take to set up OpenTelemetry?
For a single service, expect 2–4 days including testing and sampling configuration — longer for multi-service environments with custom semantic conventions.
6. What’s the difference between OpenTelemetry and Prometheus?
Prometheus is a metrics storage and querying backend. OpenTelemetry is an instrumentation and collection standard that can export data to Prometheus, among other backends.
Success Stories


Did you enjoy this article?