
Understanding and Preventing Memory Leaks in JavaScript Applications
Oct 13, 2025 5 Min Read 8429 Views
(Last Updated)
While learning JavaScript applications, developers often encounter a hidden challenge: memory leaks. These silent performance killers can slowly degrade your application, leading to sluggish behavior and, in severe cases, complete failures. Understanding and preventing memory leaks is not just beneficial; it’s important for maintaining the health and efficiency of your web applications.
In this blog post, we’ll understand memory leaks in JavaScript, highlighting their causes, detection methods, and prevention strategies. This blog will give you the knowledge to keep your applications running smoothly, ensuring a seamless experience for your users. Let’s get into memory leaks, transforming a potential threat into a manageable aspect of your development toolkit.
Table of contents
- What is a Memory Leak?
- What are the Types of Memory Leaks?
- How to Identify Memory Leaks in JavaScript?
- Understanding Symptoms
- Using Browser Developer Tools
- Performance Monitoring Tools
- Analyzing Code Patterns
- Stress Testing
- Third-Party Tools and Libraries
- Community and Resources
- Best Practices for Preventing Memory Leaks
- Mindful Allocation and Deallocation
- Efficient Event Listener Management
- Proper Use of DOM Elements
- Minimize Global Variables
- Understanding Closures
- Utilize Weak References
- Memory Leak Detection Tools
- Garbage Collection Hints
- Regular Code Reviews
- Continuous Learning and Updating
- Testing and Profiling
- Documentation and Comments
- Conclusion
- FAQs
- What leads to memory leaks in JavaScript apps?
- How can I find memory leaks in my JavaScript application?
- What are the best practices to avoid memory leaks in JavaScript?
What is a Memory Leak?
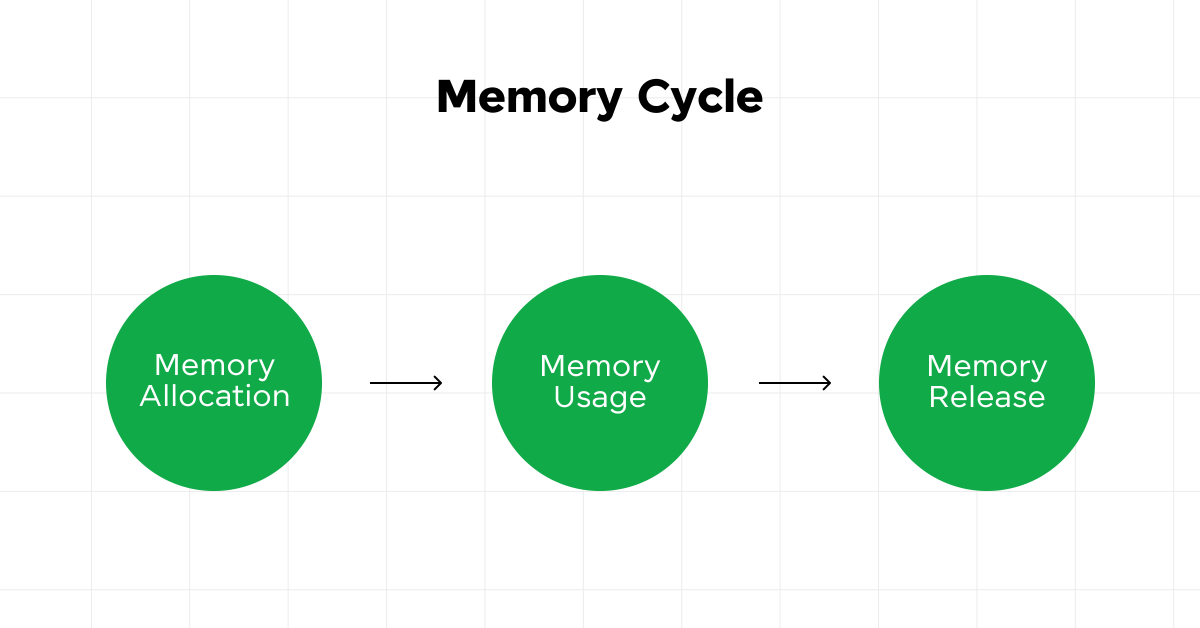
A memory leak in the context of web development, particularly in JavaScript applications, occurs when a program fails to release memory that is no longer needed. This means that the allocated memory, which is no longer useful or accessible to the program, is not returned to the pool of available memory resources.
Also Read: 10 Best Skills for Web Development
Over time, these unreleased memory portions accumulate, leading to increased memory usage by the application. This can result in a variety of negative impacts, including:
- Sluggish application performance: As the available memory decreases, the application may slow down, as it has to work harder to manage and allocate the remaining memory resources.
- Browser or application crashes: In severe cases, the system might run out of memory, causing the application or even the entire browser to crash or become unresponsive.
- Deterioration of user experience: Slow response times and potential crashes can frustrate users, leading to a poor user experience.
In JavaScript applications, memory leaks often occur due to improper handling of variables, event listeners, DOM elements, and closures. For example, if an event listener is attached to a DOM element and the element is removed from the DOM without properly removing the event listener, the browser’s JavaScript engine may still retain a reference to the element, preventing its memory from being reclaimed.
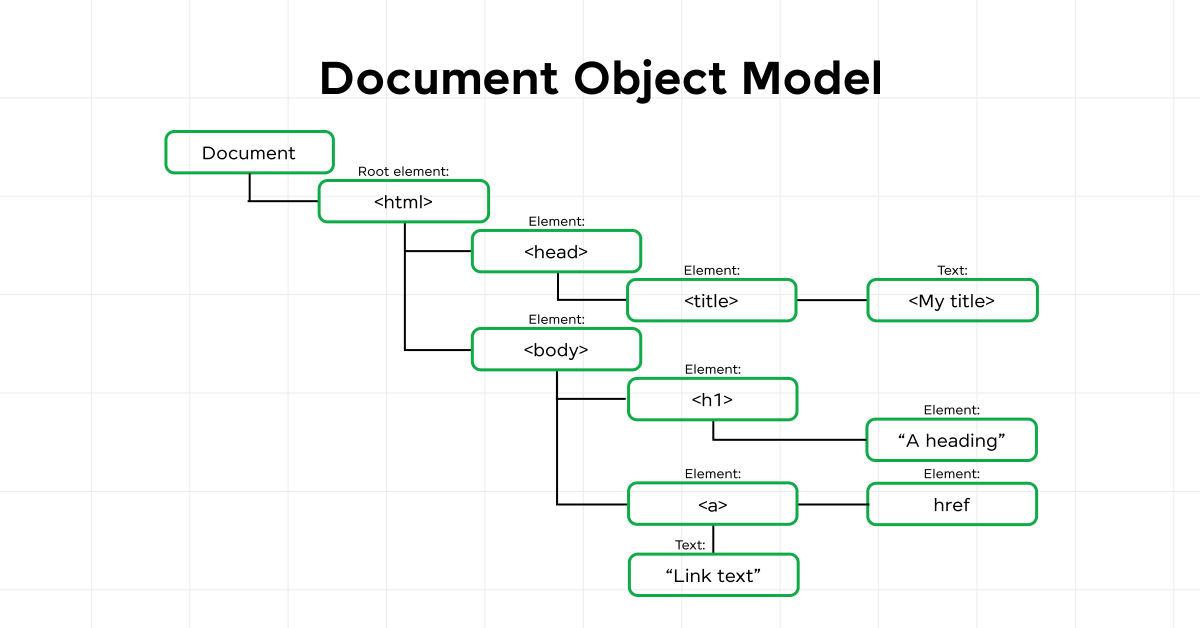
Similarly, closures can inadvertently keep references to outer variables that are no longer needed, leading to memory that cannot be freed. Identifying and preventing memory leaks requires a diligent approach to coding and an understanding of how JavaScript manages memory. This involves practices such as proper event listener management, avoiding unnecessary global variables, and being mindful of how closures capture variables, among others.
Tools like browser development tools and JavaScript profilers can help developers detect and diagnose memory leaks in their applications.
Looking to level up your web development skills? Join HCL GUVI’s Full Stack Development course and gain the expertise needed to excel in technology. Learn JavaScript and more, shaping your future in coding. Enroll now!
Now that we’ve covered what a memory leak is and why it’s important to manage memory effectively, let’s explore the various types of memory leaks.
What are the Types of Memory Leaks?
Memory leaks can occur in various programming environments and systems, leading to performance degradation and application crashes. Here are some common types of memory leaks:
- Static and Global Variables: These variables remain in memory for the lifetime of the application and can cause memory leakage if they grow unchecked without any mechanism to release or reset their memory footprint.
- Unreleased Memory Allocators: The most straightforward type of memory leak occurs when memory is allocated (e.g., using
mallocin C ornewin C++) but not released (usingfreeordelete) after it’s no longer needed. This results in a gradual increase in used memory, reducing the available memory for other processes and potentially causing the system to slow down or crash. - Data Structure Issues: Sometimes, complex data structures like linked lists, trees, or graphs can cause memory leaks if not handled correctly. If elements within these structures are removed but the memory holding the elements is not properly freed, it can result in a leak.
- Unclosed Resources: When program elements like file streams, database connections, or network connections are not closed after their use, they can keep holding memory. Although these might not strictly be considered memory leaks in the traditional sense, they behave similarly by continuously occupying memory resources.
- Memory Fragmentation: This isn’t a memory leak per se, but it can lead to similar effects, where available memory is broken up into small blocks that cannot be effectively used. This occurs when memory is frequently allocated and deallocated in varying block sizes.
- Improper Memory Management in Threads: In multi-threaded applications, improper handling of memory allocations and deallocations across threads can lead to memory leaks. This can happen if memory allocated in one thread is lost and not deallocated properly.
Each type of memory leak has its own set of challenges and requires specific strategies and tools for detection and resolution.
Also Read: Unlocking the Future: Top 5 Web Development Programming Languages
Now that we’ve explored the various types of memory leaks, let’s learn how to identify these issues in JavaScript. Identifying memory leaks early can save a lot of debugging time and maintain your application’s performance.
How to Identify Memory Leaks in JavaScript?
Identifying memory leaks in JavaScript applications is an important step in ensuring application efficiency and reliability. Memory leaks can lead to performance degradation over time, making the identification process an important skill for developers. Here are key strategies and tools to help you detect memory leaks in JavaScript:
1. Understanding Symptoms
- Sluggish Performance: If your application starts slowing down over time, especially during extended usage, it might indicate a memory leak.
- Increasing Browser Memory Usage: Monitoring the browser’s memory usage through task managers can reveal if an application’s memory footprint grows unexpectedly.
- Unresponsive Interface: A UI that becomes increasingly laggy or unresponsive may be suffering from memory leaks.
2. Using Browser Developer Tools
- Memory Timeline: Tools like Chrome DevTools allow you to record memory usage over time. Look for the memory timeline or heap snapshots feature to identify trends of increasing memory consumption.
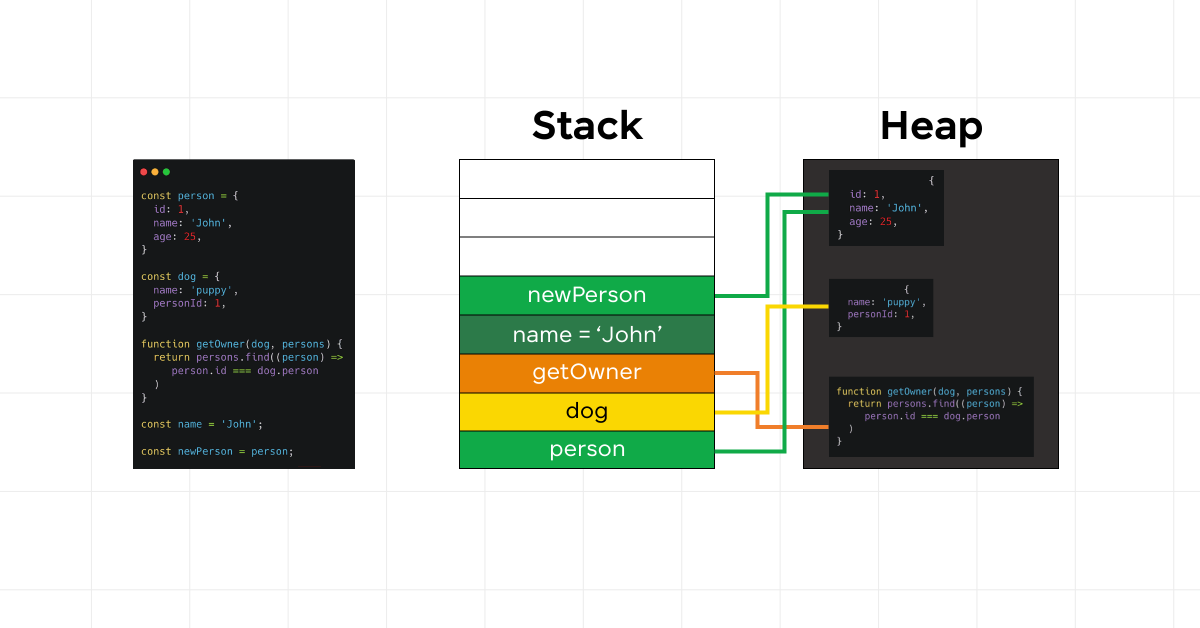
- Heap Snapshots: Taking heap snapshots at different stages of your application can help you identify objects that are retained in memory longer than necessary.
- Comparison of Snapshots: By comparing heap snapshots taken at different times, you can identify objects that are being added to the memory and not being released.
Also Read: The Most Popular Java Tools for Every Phase of Development
3. Performance Monitoring Tools
- JavaScript Profilers: Most modern browsers come with built-in profilers that can help you understand where your application is spending its time and memory.
- Custom Monitoring Scripts: Writing custom scripts to monitor and log memory usage over time can help in identifying gradual leaks.
4. Analyzing Code Patterns
- Event Listeners: Unremoved event listeners are a common source of memory leaks. Ensure that listeners are removed when they are no longer needed.
- Detached DOM Elements: Elements removed from the DOM can still be retained in JavaScript variables or closures, leading to memory leaks.
- Global Variables: Excessive use of global variables can keep memory from being freed. Analyze your use of globals and reduce them where possible.
5. Stress Testing
- Simulate User Actions: Replicating user interactions extensively can accelerate the appearance of memory leaks, making them easier to detect.
- Automated Testing Tools: Tools that simulate heavy usage of your application can help in uncovering leaks that might only become apparent under stress.
Also Read: Real-World Automation Testing Applications
6. Third-Party Tools and Libraries
- Memory Leak Detection Libraries: There are libraries and tools specifically designed to detect memory leaks in JavaScript applications, which can be integrated into your development and testing workflows.
7. Community and Resources
- Open Source Repositories: Many developers share their tools and scripts for memory leak detection, which can be adapted for your needs.
- Forums and Discussions: Developer communities can be a rich source of information. Sharing your findings and learning from others’ experiences can provide insights into common pitfalls and best practices.
Identifying memory leaks early and regularly in the development process can save a lot of time and effort in the long run, ensuring that your application remains efficient and provides a smooth user experience.
Also Read: 6 Emerging Programming Languages for Backend Development
Now that we’ve explored how to identify memory leaks in JavaScript, let’s learn some of the best practices for preventing memory leaks and ensuring your applications run smoothly and efficiently.
Best Practices for Preventing Memory Leaks
Preventing memory leaks in JavaScript applications is important for ensuring optimal performance and user experience. Adopting best practices in your development process can significantly reduce the risk of memory leaks. Here are some effective strategies:
1. Mindful Allocation and Deallocation
Understand how your code allocates memory, particularly in loops and recursive functions, and ensure you’re deallocating memory when it’s no longer needed.
2. Efficient Event Listener Management
Always remove event listeners when they’re no longer needed, especially in Single Page Applications (SPAs) where elements are dynamically added and removed. Instead of attaching event listeners to each element, use event delegation to attach a single listener to a parent element.
Also Read: Real-world Web Development Applications
3. Proper Use of DOM Elements
Ensure that references to DOM elements are removed when the elements are no longer in use, to prevent them from being retained in memory. When manipulating multiple DOM elements, consider using document fragments to minimize reflows and avoid unnecessary memory usage.
4. Minimize Global Variables
Use local variables wherever possible, as global variables can remain in memory throughout the lifecycle of an application, potentially leading to leaks. Immediately Invoked Function Expressions (IIFEs) and modules can help encapsulate and protect your code from unwanted global scope pollution.
Must Read: Top 9 Web Development Tools
5. Understanding Closures
Closures are powerful but can easily lead to memory leaks if not used wisely. Ensure that closures are not inadvertently keeping references to larger objects than necessary.
6. Utilize Weak References
When storing references to objects that you don’t want to prevent from being garbage-collected, consider using WeakMap or WeakSet, which don’t prevent their elements from being garbage-collected.
7. Memory Leak Detection Tools
Regularly use memory leak detection tools as part of your testing and development process to catch leaks early.
8. Garbage Collection Hints
Setting variables that are no longer needed to be null can sometimes help the garbage collector identify that the memory can be freed, though this is more of a hint than a guarantee.
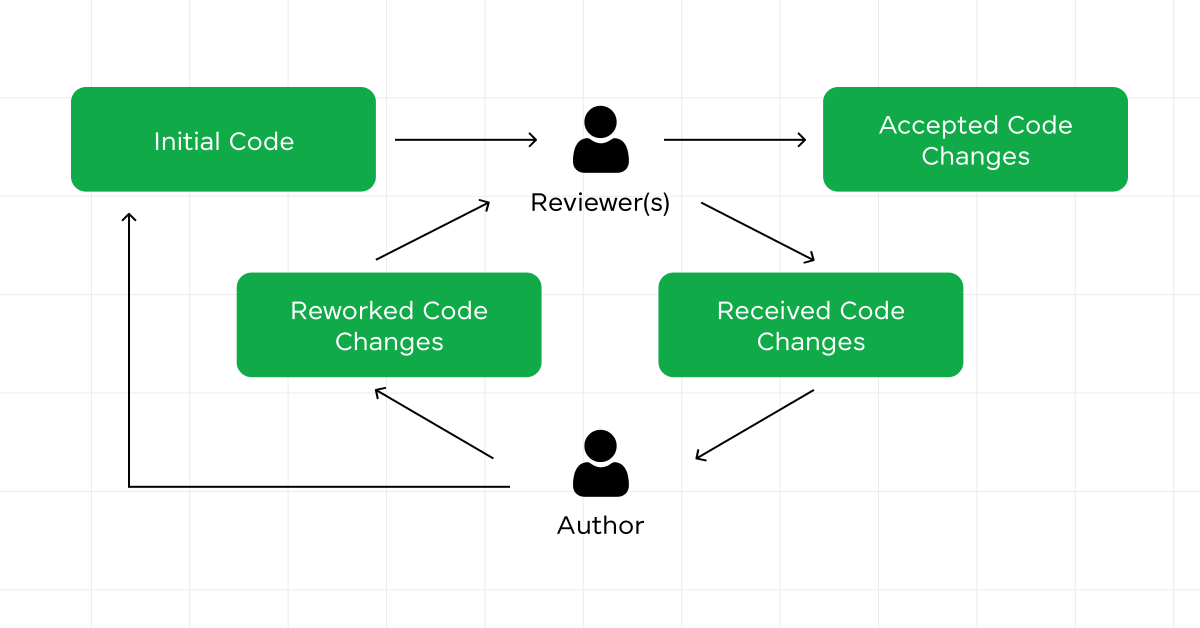
9. Regular Code Reviews
Regular code reviews with a focus on memory management can help catch potential memory leaks early in the development process.
10. Continuous Learning and Updating
JavaScript engines and best practices evolve, so staying informed about the latest updates and techniques is important for effective memory management.
Also Read: Top ReactJS Interview Questions and Answers! [Part-1]
11. Testing and Profiling
Use profiling tools to monitor your application’s memory usage, especially after adding new features or making significant changes.
Also Read: Top 100+ Manual Testing Interview Questions and Answers
12. Documentation and Comments
When using patterns or coding in ways specifically designed to prevent memory leaks, document your approach to help future maintainers understand your intentions.
Also Read: Coding Canvas: A Structured & Powerful Approach to Learn Programming
By integrating these best practices into your development workflow, you can greatly reduce the risk of memory leaks in your JavaScript applications, leading to more efficient, reliable, and user-friendly web experiences.
Conclusion
Let this exploration of memory leaks in JavaScript help in further learning and improvement in your development practices. Embrace the tools and techniques available, share knowledge with your peers, and continually seek to refine your approach to memory management.
Remember, the most effective way to deal with memory leaks is not just to fix them but to prevent them from happening in the first place. Here’s to leak-free applications that delight and engage users at every interaction!
Also Explore: 7 Unique Web Development Project Ideas for Beginners
FAQs
What leads to memory leaks in JavaScript apps?
Common causes include unremoved event listeners, detached DOM elements, misused closures, overused global variables, and forgotten timers or intervals.
How can I find memory leaks in my JavaScript application?
Use browser developer tools for heap snapshots and memory timelines, employ performance monitoring tools, write custom memory monitoring scripts, or integrate third-party memory leak detection libraries.
What are the best practices to avoid memory leaks in JavaScript?
Manage resources carefully, especially in loops and functions. Properly handle event listeners and DOM elements, use WeakMaps or WeakSets for non-essential references, conduct regular code reviews focusing on memory usage, and stay updated on best memory management practices.





Did you enjoy this article?