


Full Stack Development Articles
Claude for Architecture and Engineering Documentation
Freelancing as a Python Developer: Getting Your First Client


Get In Touch For Details! Request More Information
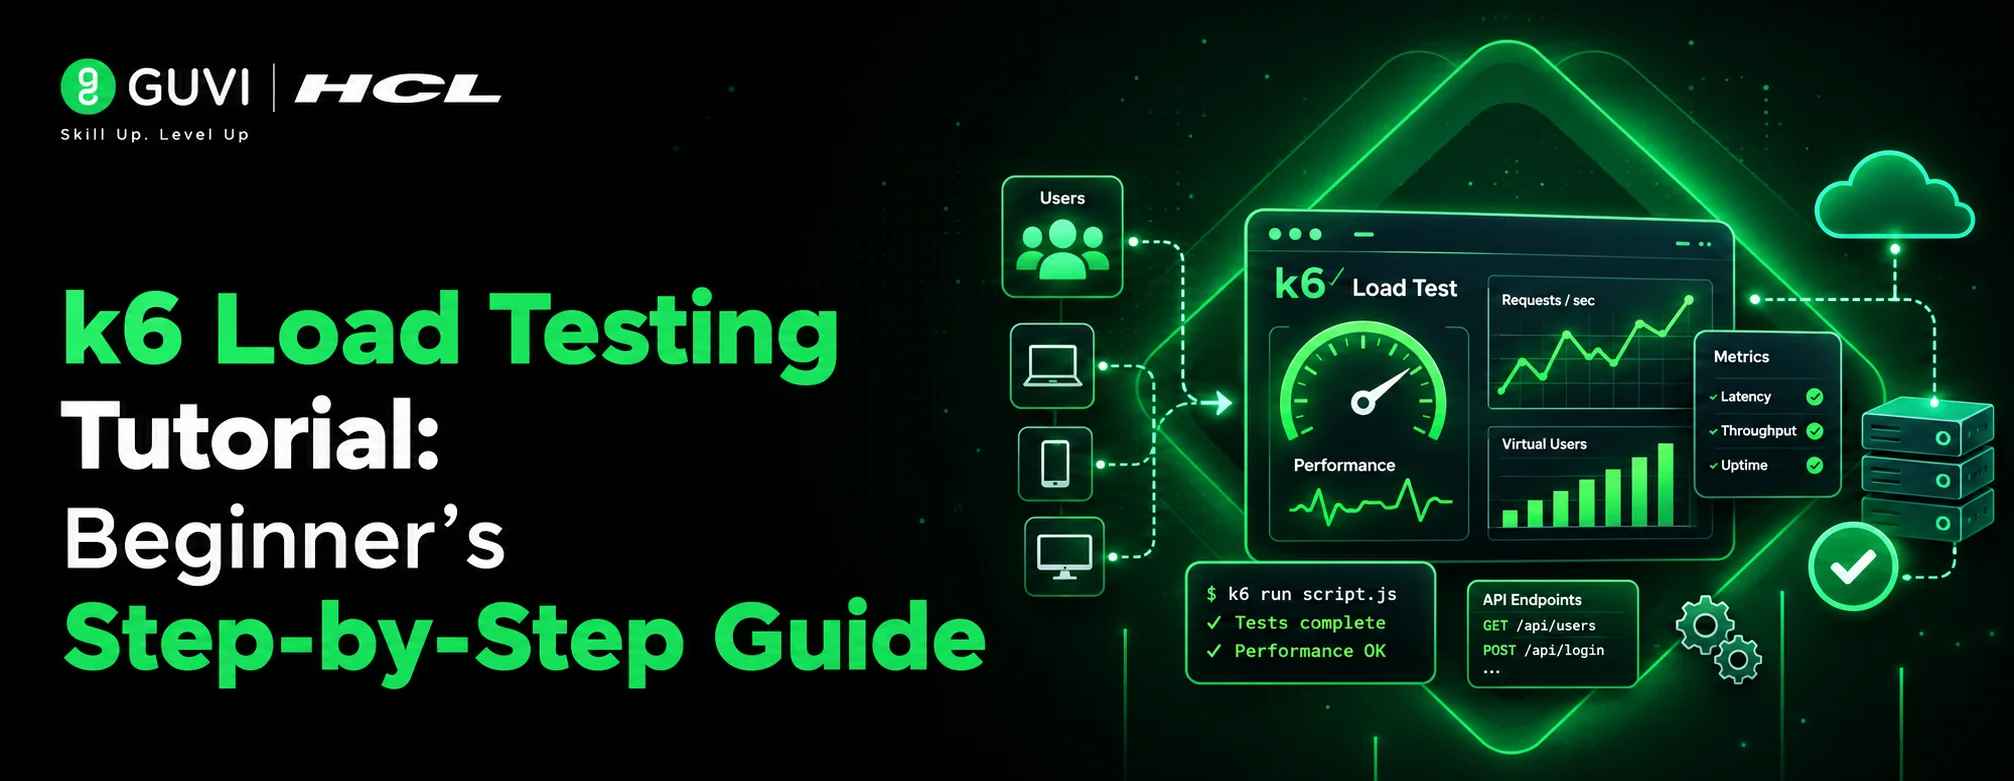
k6 Load Testing Tutorial: Beginner’s Step-by-Step Guide
Sep 19, 2026 3 Min Read 322 Views
(Last Updated)
k6 is an open-source load testing tool that helps developers and QA teams measure application performance under real-world traffic conditions. A typical k6 workflow involves writing test scripts in JavaScript, defining virtual users, running tests, and analyzing performance metrics.
Table of contents
- TL;DR
- What Is k6 Load Testing?
- Why Is Load Testing Important?
- Why Is k6 Popular?
- Developer-Friendly Scripting
- Lightweight Architecture
- CI/CD Integration
- Cloud and Local Execution
- How Does k6 Work?
- How to Install k6
- Windows
- macOS
- Linux
- How Do You Create Your First k6 Load Test?
- Simulating Multiple Users
- Understanding Metrics
- Best Practices
- Start Small
- Test Real User Flows
- Define Performance Targets
- Monitor Infrastructure
- Common Mistakes Beginners Make
- Testing Too Few Users
- Ignoring Think Time
- Not Monitoring Servers
- Focusing Only on Average Response Time
- Conclusion
- FAQs
- What is k6 used for?
- Is k6 free to use?
- Is JavaScript required for k6?
- Can k6 test APIs?
- How many users can k6 simulate?
- Is k6 better than JMeter?
- Can k6 be integrated with Grafana?
TL;DR
- k6 is a modern open-source performance testing tool.
- You can simulate thousands of users with JavaScript scripts.
- It helps identify bottlenecks before users experience them.
- It integrates with CI/CD pipelines and Grafana.
- Beginners can start load testing in minutes.
What Is k6 Load Testing?
k6 load testing is the process of using the k6 tool to simulate user traffic and evaluate how an application performs under different workloads.
Performance issues rarely appear when only a few users access your application. Problems often emerge when hundreds or thousands of users interact simultaneously.
k6 helps you answer questions such as:
- Can my application handle peak traffic?
- What happens if traffic suddenly doubles?
- Which API endpoints are slowing down?
- At what point does performance degrade?
Unlike traditional testing tools that rely heavily on graphical interfaces, k6 follows a code-first approach, making it especially attractive for developers and DevOps teams.
Why Is Load Testing Important?
Load testing reveals performance bottlenecks before they affect real users.
Imagine launching a new feature after months of development. Everything works perfectly during internal testing. Then a marketing campaign drives thousands of visitors to your website.
The result?
- Slow page loads
- API failures
- Database timeouts
- Lost revenue
According to research from Google, users expect pages to load quickly, and performance issues directly impact engagement and conversion rates.
Data Point
A delay of even a few seconds can significantly reduce user satisfaction and conversion rates.
Why Is k6 Popular?
k6 combines simplicity, scalability, and automation, making it one of the most developer-friendly load testing tools available today.
Key reasons teams choose K6:
Developer-Friendly Scripting
Tests are written in JavaScript.
import http from 'k6/http';

export default function () {

   http.get('https://example.com');

}
Lightweight Architecture
Unlike some legacy tools, k6 doesn’t require a heavy GUI.
CI/CD Integration
k6 works smoothly with:
- GitHub Actions
- GitLab CI/CD
- Jenkins
- Azure DevOps
Cloud and Local Execution
You can run tests:
- On your laptop
- In Docker containers
- In Kubernetes
- In cloud environments
Pro Tip
Treat performance tests like application code. Store k6 scripts in the same repository as your project and run them automatically during deployments.
How Does k6 Work?
Answer: k6 simulates virtual users (VUs) that perform actions defined in JavaScript scripts.
The workflow is straightforward:
Write Script
↓
Configure Users
↓
Run Test
↓
Collect Metrics
↓
Analyze Results
↓
Optimize Application
How to Install k6
Windows
Using Chocolatey:
choco install k6Using Winget:
winget install k6macOS
brew install k6Linux
sudo gpg -k
sudo apt install k6
Verify installation:
k6 versionYou should see the installed version number.
How Do You Create Your First k6 Load Test?
Create a JavaScript file, define a request, and execute it using the k6 command-line tool.
Create a file named:
loadtest.jsAdd:
import http from 'k6/http';

export default function () {

   http.get('https://test.k6.io');

}
Run the test:
k6 run loadtest.jsk6 automatically displays performance statistics after execution.
Simulating Multiple Users
Let’s simulate 50 users.
import http from 'k6/http';

export const options = {

   vus: 50,

   duration: '30s',

};

export default function () {

   http.get('https://test.k6.io');

}
Execute:

k6 run loadtest.jsThis creates:
- 50 virtual users
- 30-second duration
- Continuous requests during the test
Understanding Metrics
k6 generates detailed performance metrics that help identify system bottlenecks.
Common metrics include:
| Metric | Meaning |
| http_req_duration | Total response time |
| http_req_failed | Failed requests |
| iterations | Number of completed loops |
| vus | Active virtual users |
| data_received | Downloaded data |
| data_sent | Uploaded data |
Example output:
http_req_duration……..: avg=210ms
http_req_failed……….: 0.00%
Interpretation:
- Average response time: 210 ms
- No failed requests
Best Practice
Track trends over time instead of focusing on a single test result.
Best Practices
Start Small
Begin with:
- 10 users
- 30-second tests
Gradually increase load.
Test Real User Flows
Avoid testing only the homepage.
Include:
- Login
- Search
- Checkout
- API calls
Define Performance Targets
Example:
- Response time < 500 ms
- Error rate < 1%
Monitor Infrastructure
Watch:
- CPU
- Memory
- Database metrics
- Network usage
Common Mistakes Beginners Make
Testing Too Few Users
Small tests rarely expose bottlenecks.
Ignoring Think Time
Real users don’t click continuously.
Not Monitoring Servers
Performance metrics alone don’t reveal root causes.
Focusing Only on Average Response Time
Always examine:
- p95
- p99
- Error rates
If you want a structured, mentor-supported path through everything in a roadmap, HCL GUVI’s IIT-M Pravartak Certified Full Stack Developer Course with AI Integration covers the entire journey, from HTML to deployment, with real projects, live sessions, and placement support. Over 10,000 students have used it to break into product-based companies.
Conclusion
k6 has become one of the most practical performance testing tools available for modern software teams. Its lightweight architecture, JavaScript-based scripting model, and strong automation capabilities make it an excellent choice for developers, QA engineers, and DevOps professionals.
If you’re new to performance testing, start with a simple script, learn the core metrics, and gradually build realistic test scenarios. Consistent testing will help you catch bottlenecks early and deliver faster, more reliable applications.
Ready to strengthen your performance testing skills? Start by creating your first k6 script today and make load testing a regular part of your development workflow.
FAQs
1. What is k6 used for?
k6 is used for load testing, stress testing, and performance testing web applications, APIs, and services by simulating virtual users and measuring system behavior.
2. Is k6 free to use?
Yes. k6 is open-source and free to use locally. Additional cloud-based features are available through commercial offerings.
3. Is JavaScript required for k6?
Yes. k6 scripts are written in JavaScript, but beginners can learn the required syntax quickly because the scripts are usually simple.
4. Can k6 test APIs?
Absolutely. API testing is one of the most common k6 use cases. It supports GET, POST, PUT, DELETE, and other HTTP methods.
5. How many users can k6 simulate?
The number depends on your hardware and environment. With distributed testing setups, k6 can simulate very large traffic loads.
6. Is k6 better than JMeter?
k6 is generally easier for developers and CI/CD workflows, while JMeter may be preferred by teams that rely heavily on graphical interfaces.
7. Can k6 be integrated with Grafana?
Yes. k6 integrates with Grafana, Prometheus, InfluxDB, and other observability platforms for advanced performance monitoring.
Success Stories

About the Author
Vishalini Devarajan
An Aerospace Engineer turned content writer, I focus on making complex concepts easy to understand through well-structured, reader-friendly blogs. Whether it’s a technical topic or a non-technical one, I love creating content that is clear, engaging, and impactful.
View all posts by Vishalini Devarajan
Connect with me @





































Did you enjoy this article?