What is R Programming – A Comprehensive Guide for Beginners in Data Science
Oct 13, 2025 4 Min Read 4602 Views
(Last Updated)
If you’re into the world of data science, then you have probably encountered the programming language R. But what exactly is R? And why has it become so popular among the data analysts?
In this blog, we’ll explore the R programming language, its unique strengths against data analysts and how it can help you to unlock your data analysis skills. Whether you’re a beginner or looking to deepen your knowledge in R language, this guide will give you a solid foundation in R and its role in the data science world.
Table of contents
- What is R?
- Why is R Popular in Data Science?
- R for Data Analysis
- Difference between R and Python
- Getting Started with R
- Install R and RStudio
- Set Up Your R Script
- Basic Syntax in R
- Variables
- Vectors
- Functions
- Data Frames
- R Libraries and Packages
- Where is R programming used?
- Conclusion
- FAQs
- Q1. Is R suitable for beginners?
- Q2. Can I use R for machine learning?
- Q3. How does R compare to Python in data analysis?
- Q4. Is R free to use?
What is R?
R is a programming language especially designed for statistical computing and data analysis problems. It was developed by Ross Ihaka and Robert Gentleman in 1993 at the University of Auckland in New Zealand. Since then, R has become one of the most widely used languages in data science, particularly for data visualization, statistical modeling, and machine learning.
Why is R Popular in Data Science?
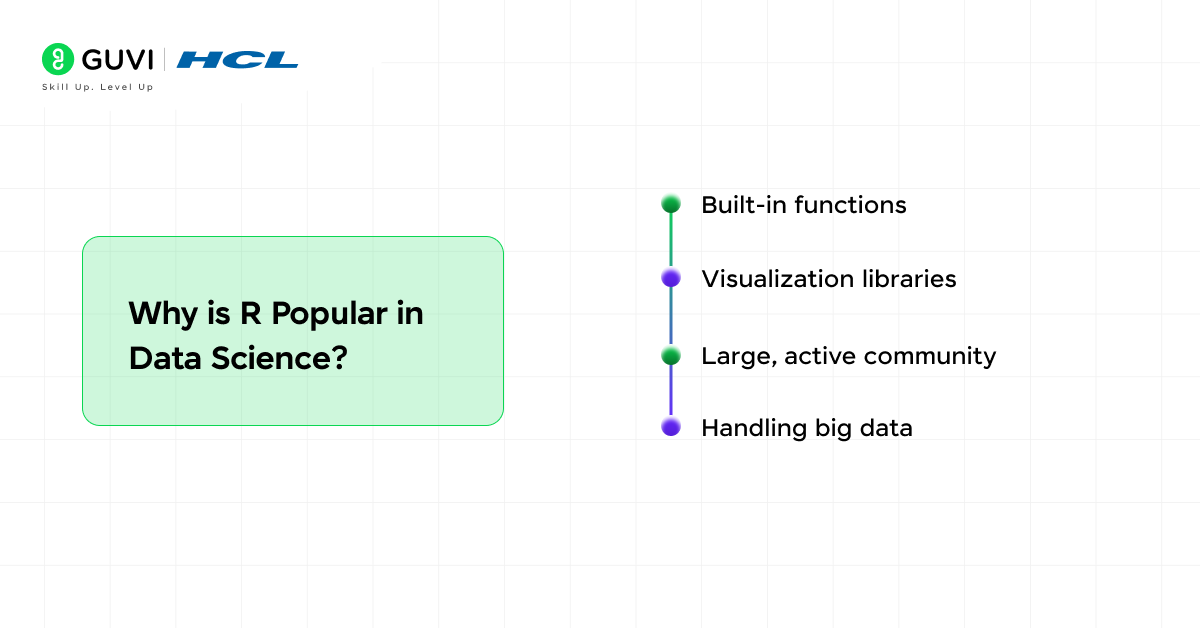
The main advantage of R is its ability to handle large datasets, perform complex statistical analyses, and visualize the data in a way that is easy to interpret. It is a powerful tool for researchers, statisticians, and data analysts to make data-driven decisions quickly and efficiently. Let’s look into some of the reasons that R has become popular in data science.
- It provides various built-in functions and libraries for data analysis, making the advanced process easier.
- It offers powerful visualization libraries such as ggplot2 that make it easy to create beautiful, customized visualizations to represent the data.
- R is open source, and its large, active community of users continuously contributes to its development.
- It is a great fit for handling big data with the help of tools like dplyr and data. table
Now that we have seen the reason for its popularity. Let’s look at how R is used for the data analysis process.
R for Data Analysis
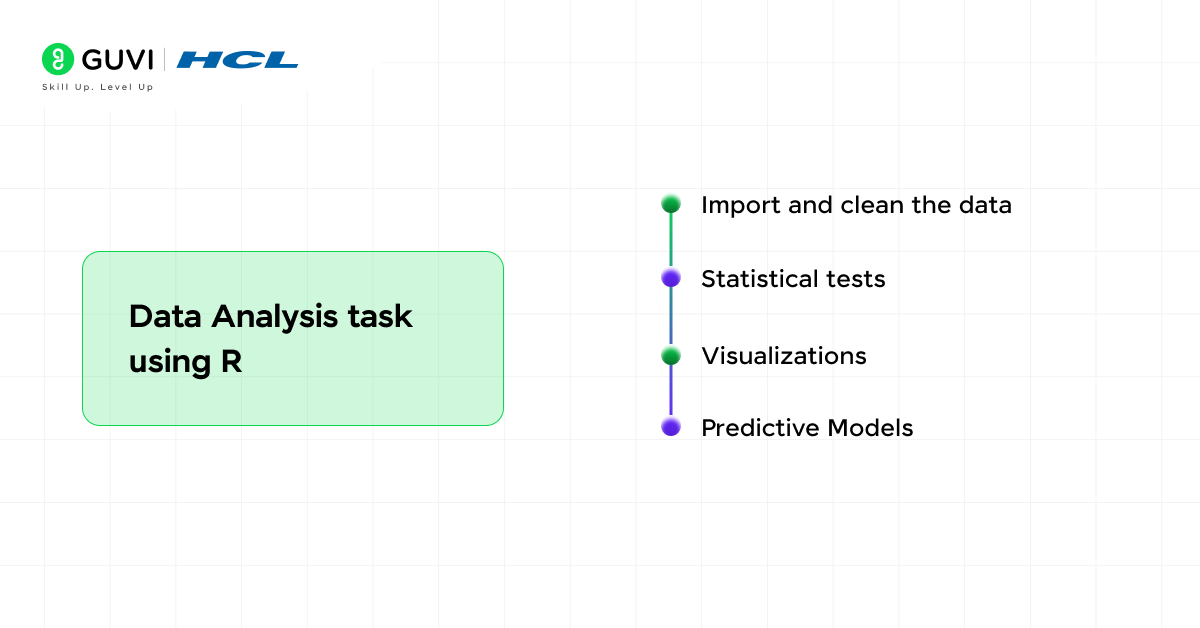
R is widely used in data analysis because of its ability to handle, manipulate, and visualize data. You can use R to do the following tasks:
- Import and clean the data: With the help of functions like read.csv() and packages like tidyverse, you can import the dataset and clean it up.
- Statistical tests: It has numerous built-in functions such as hypothesis testing, ANOVA, and chi-square tests to perform statistical tests.
- Visualizations: From basic box plots to complex heatmaps, it is easy to visualize the data and uncover patterns in R.
- Predictive Models: Using machine learning models from linear regression to advanced techniques like random forest and neural networks can be built easily using R.
Difference between R and Python
You may doubt that even Python does the same thing with several built-in functions and packages. So, in this section, we will dive deep into the difference between R and Python.
| Aspect | Python | R |
| Primary Use | A steeper learning curve and syntax can be complex for beginners | Statistical and data analysis |
| Learning Curve | Easy for beginners due to simpler syntax | Steeper learning curve and syntax can be complex for beginners |
| Performance | Faster for programming tasks | Optimized for larger statistical and data analysis |
| Community | Larger community for general-purpose | Stronger community for statistical and data science. |
Getting Started with R
Are you ready to get started with the R language? Before we start, there are a couple of things you need to set up. Let’s look into that.
Install R and RStudio
RStudio is the integrated Development Environment (IDE) for writing and running R code. You can download both R and RStudio from their official Website. Based on your operating system, such as Windows, Mac, or Linux, you can download the latest desktop version of RStudio.
After downloading RStudio, you might need to install it. Open the downloaded file and start installing the IDE. It will automatically install R and set up the environment variables in your system.
Set Up Your R Script
Once the installation has finished. Open RStudio -> create a new script and start coding! Try to write some simple code, like printing a “Hello” message with the `print()` function.
| print(“Hello, R!”) # Output: Hello, R! |
Hurray! You’ve written your first code in the R language. If you want to start your career in data science, check out HCL Guvi’s free e-book on Master the Art of Data Science. It provides a complete guide and roadmap to learn data science from scratch.
Basic Syntax in R
Let’s look into the basic R syntax to get comfortable with the R language. The concept and idea about the variable, function, and class will be the same for all the languages, only the implementation will be slightly different. If you’ve a decent understanding of Python, then learning R will be a piece of cake for you.
Variables
To define a variable in R, you can use the code below.
| x <- 5 # Assign 3 to variable x print(x) # Print the value of x y <- 10 # Assign 10 to variable y print(y) # Print the value of y |
Vectors
Use the code below to define vectors in R. Vectors are known as arrays in other languages.
| Numbers <- c(1, 2, 3, 4, 5) # Create a vector |
Functions
Use the code below to implement a function in the R language. Here, sum is the built-in function to sum the vector values.
| sum_of_numbers <- sum(numbers) # Sum the values of the vector print(sum_of_numbers) |
Data Frames
Below is the sample code to implement a dataframe in R.
| df <- data.frame(Name = c(“Roopa”, “Dharshini”), Age = c(24, 25)) print(df) |
Now that we have seen the basic syntax in R, in the next section, let’s look into some useful libraries and packages in the R language.
Are you curious to learn more about the syntax of R and build a project using R? Then, HCL Guvi’s course on R programming might be the best for you to start with. This course provides industry-recognized certification along with hands-on experience in building solutions to real-world problems.
R Libraries and Packages
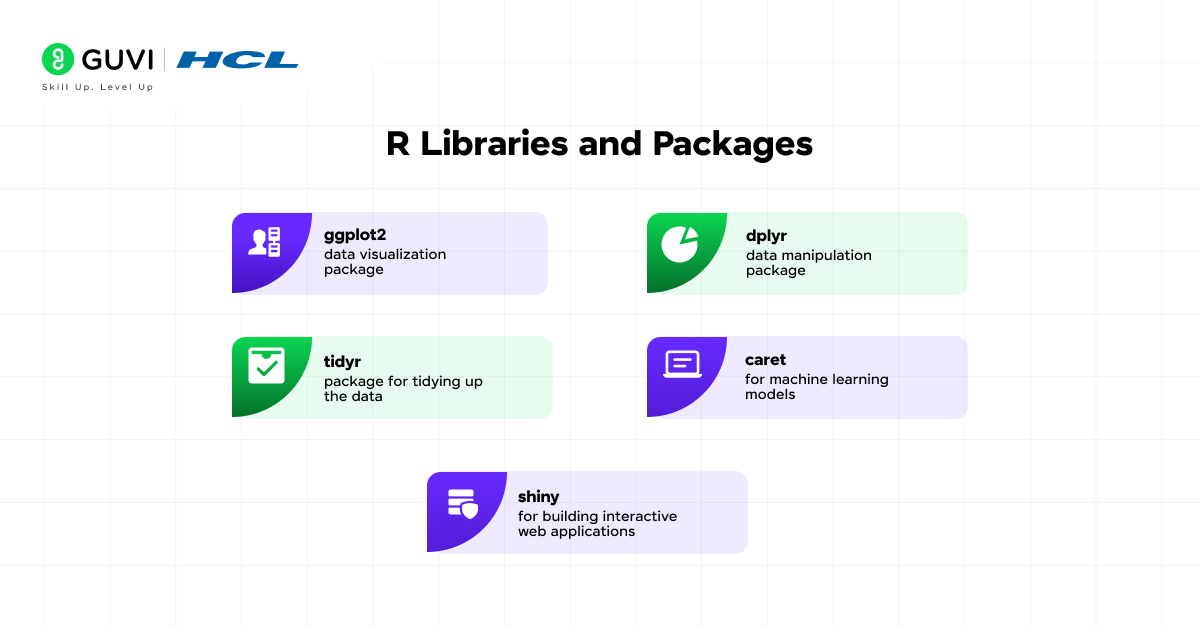
R is incredibly powerful because of its libraries and packages. Some of the most popular packages in R include the following. These packages can be installed using the install.packages() function.
- ggplot2: data visualization package
- dplyr: data manipulation package
- tidyr: package for tidying up the data
- caret: for machine learning models
- Shiny: for building interactive web applications
Where is R programming used?
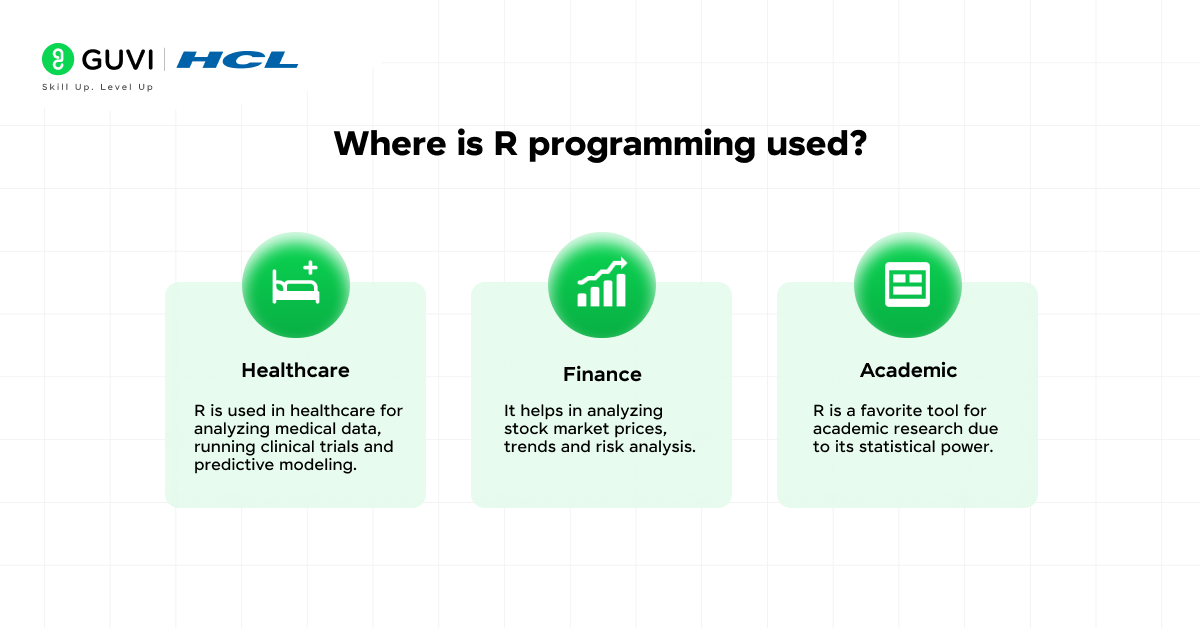
R is widely used in various industries to solve real-world problems. Some of them include:
- Healthcare: R is used in healthcare for analyzing medical data, running clinical trials, and predictive modeling.
- Finance: It helps in analyzing stock market prices, trends, and risk analysis.
- Academic: R is a favorite tool for academic research due to its statistical power.
Conclusion
R is an incredibly powerful tool and language for data analysis, statistical modeling, and data visualization. Whether you’re working in research, business, finance, or healthcare, learning R will help you to enhance your analytical skills and interpret the data.
With all these library and package-rich features, R will always stand at the top. As you get comfortable with its syntax and libraries, you will find it to be an indispensable tool in your data science career journey.
FAQs
Q1. Is R suitable for beginners?
Yes, R has a bit of a learning curve, but it’s highly accessible to beginners, especially those with a background in statistics or data analysis.
Q2. Can I use R for machine learning?
Absolutely! R has numerous packages, such as caret and randomForest, that make building machine learning models easy.
Q3. How does R compare to Python in data analysis?
While Python is more versatile and used for general-purpose programming, R excels in statistics and specialized data analysis tasks. The choice depends on your project requirements.
Q4. Is R free to use?
Yes, R is open-source and free to download and use.











Did you enjoy this article?