
Master Python for Data Science in 2025: A Complete Guide
Apr 14, 2025 7 Min Read 3826 Views
(Last Updated)
Python data science jobs have jumped 46% since 2019. The field offers an attractive average salary of ₹14 LPA in India. Quite the salary, isn’t it? Do you want your Python skills to provide a sum like this for you?
A significant 75% of hiring managers say Python skills are vital for data professionals. And saying this, I also know how difficult it is to navigate learning Python, specifically for data science, the libraries, the frameworks, the projects, it can be a little daunting at first, but I’m here to help make it simpler.
Hence, this guide will help you become skilled at Python programming for data science. You’ll learn everything from Python libraries to practical applications. It covers what you need to become proficient in this versatile language that drives modern data analysis and machine learning.
Table of contents
- Why Use Python for Data Science?
- 1) Open-source and versatile
- 2) Rich ecosystem of data science libraries
- 3) Strong community support and growing demand
- 4) Easy integration with big data and AI frameworks
- Must-Know Python Libraries for Data Science
- NumPy
- Pandas
- Matplotlib & Seaborn (Visualization Libraries)
- Scikit-Learn
- TensorFlow & PyTorch (Deep Learning Libraries)
- Python Roadmap for Data Science
- 1) Fundamentals of Python
- 2) Data Handling & Preprocessing
- 3) Exploratory Data Analysis (EDA)
- Machine Learning with Python
- Deep Learning and NLP in Python
- Concluding Thoughts…
- FAQs
- Q1. How long does it typically take to learn Python for data science?
- Q2. What are the essential Python libraries for data science?
- Q3. Do I need a strong math background to learn Python for data science?
- Q4. How can I practice my Python data science skills?
- Q5. Is a Python certification necessary for a data science career?
Why Use Python for Data Science?
Python stands as the gold standard programming language for data science professionals worldwide. Recent surveys show Python at the top of programming languages in both the TIOBE index and PYPL Index. This success isn’t by chance.
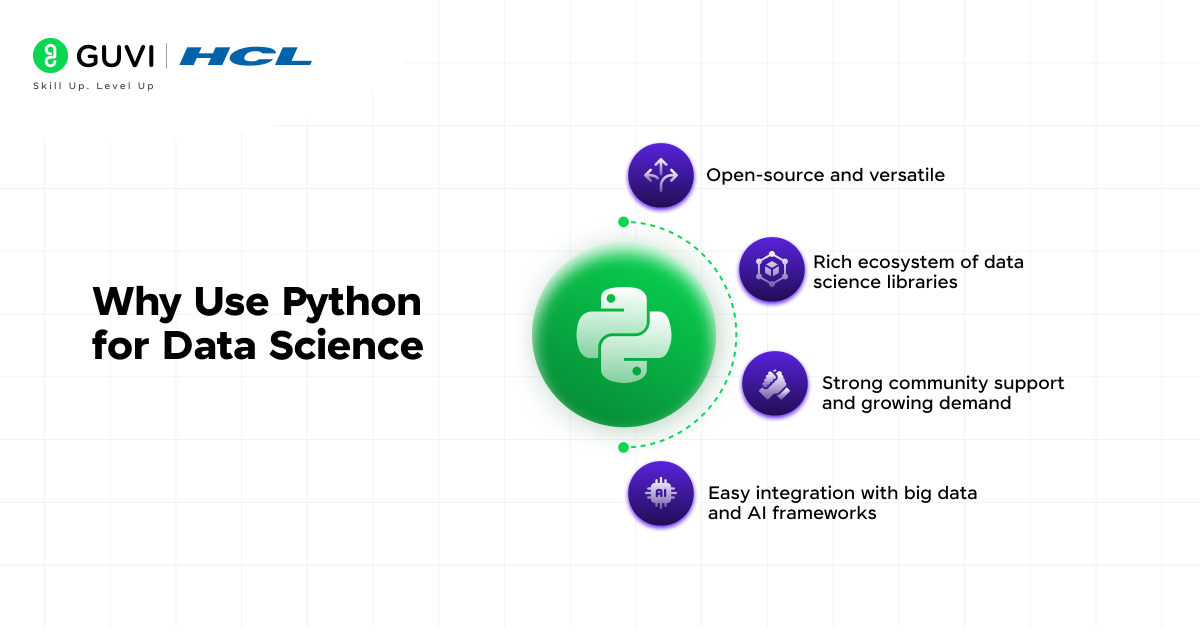
Python combines ease of use, power, and flexibility, which makes it perfect for data science applications. Let’s look at what makes Python such a vital tool for anyone serious about data science:
1) Open-source and versatile
Python comes with a major advantage – it’s completely free. You can use and share this open-source language without cost, even in commercial projects. Students, researchers, and companies of all sizes can start their data science journey without financial barriers.
- Python does much more than just being free. You’ll find Python in almost every technical field – from web development to IoT networks and complex data science projects. Data scientists can stick to one language throughout their work instead of jumping between different tools.
- The language keeps things simple and readable. Python’s clean design helps data scientists solve problems without getting stuck on complex programming rules. People moving into data science from non-engineering backgrounds find it much easier to learn.
- Python grows with your needs. It works just as well for small personal projects as it does for large enterprise systems. Teams can quickly test ideas and build production-grade applications without changing their core technology.
2) Rich ecosystem of data science libraries
Python’s biggest strength in data science comes from its vast collection of specialized libraries. With over 137,000 libraries, Python has tools for practically every data science task you can think of.
The Python data science ecosystem offers specialized libraries for different parts of analysis:
- Data Manipulation and Analysis: Pandas gives you powerful ways to handle numerical tables and time series. NumPy provides essential math functions and fast array operations that support scientific computing in Python.
- Data Visualization: Matplotlib and Seaborn help create high-quality visuals and interactive plots that communicate findings effectively.
- Machine Learning and AI: Scikit-learn offers simple tools for data mining and analysis. TensorFlow and PyTorch provide complete systems for building and training deep learning models.
- Scientific Computing: SciPy builds on NumPy with extra functions for optimization, integration, interpolation, and other scientific calculations.
These libraries save data scientists valuable development time. Instead of writing complex algorithms from scratch, you can use these tools to focus on getting insights from your data. The libraries work together naturally, creating a complete system for data science workflows.
3) Strong community support and growing demand
A thriving, active community powers Python’s success in data science. Users from universities, companies, and independent developers create a rich mix of knowledge and resources. They help Python grow by developing libraries, creating learning materials, and helping others.
- The Python community is huge. Platforms like Kaggle connect more than 23 million machine learning practitioners and data scientists who use Python. This large network creates plenty of chances to work together, learn, and solve problems.
- New Python learners find great resources everywhere. From detailed guides and tutorials to help on Stack Overflow, Python Discord, and Reddit, beginners quickly get answers. Python Weekly newsletter, PySlackers Slack community, and local meetups help everyone stay current.
- Jobs requiring Python skills are abundant. This high demand makes Python skills valuable for careers. Many data science, machine learning, and AI positions ask for Python knowledge. As companies rely more on data-driven decisions, knowing Python becomes crucial for career growth.
4) Easy integration with big data and AI frameworks
Today’s data science often deals with huge datasets and complex AI models. Python handles these challenges well by working smoothly with specialized big data and AI tools.
- Python works great with Hadoop, the most popular open-source big data platform. Libraries like PySpark let Python users employ Apache Spark’s distributed computing to process large-scale data. Data scientists can use Python’s friendly syntax for big data problems that usually need special expertise.
- Cloud platforms also embrace Python. Google Cloud AI, Microsoft Azure AI, and AWS provide Python-based APIs that make it easy to deploy, scale, and manage machine learning models. Teams can move from local development to cloud production without major code changes.
- Python can also work with other programming languages. When speed matters, Python code can connect with C/C++ and Java, combining easy use with better performance. Teams can optimize their technology based on what each project needs.
- Python leads the way in artificial intelligence research and practice. Most cutting-edge AI projects and tools use Python. Libraries like TensorFlow, Keras, and PyTorch make advanced AI techniques available to everyone.
These advantages make Python worth learning for data science in 2025. Its mix of accessibility, powerful libraries, community support, and integration abilities keeps Python as the top language in data science for the years ahead.
Also read our trending and extensive e-book on Python: A Beginner’s Guide to Coding & Beyond and learn all about Python through a guide hand-crafted by experts to help you master it easily.
Must-Know Python Libraries for Data Science
Python’s specialized libraries are what make it shine as a data science tool. These libraries turn Python from a regular programming language into a powerful data science toolkit. You can solve complex analytical problems with just a few lines of code.
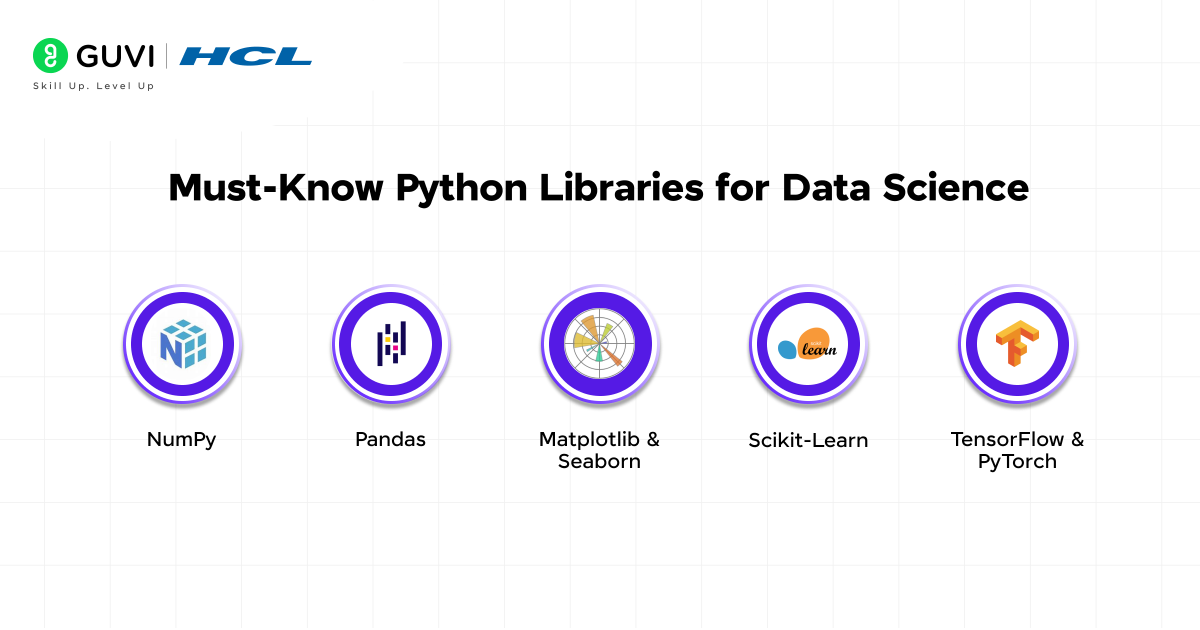
1. NumPy
NumPy (Numerical Python) is the foundation of numerical computing in Python. It provides fast and efficient operations on large datasets, making it the backbone of many other data science libraries like Pandas, Scikit-Learn, and TensorFlow.
Key Features:
- Multi-dimensional array (ndarray) for efficient data storage
- Advanced mathematical functions (linear algebra, Fourier transforms, random number generation)
- Broadcasting for handling different-sized arrays in operations
- Highly optimized performance with C and Fortran integration
Use Case: NumPy is widely used in scientific computing, big data processing, and AI applications. For example, in machine learning, it helps with handling feature matrices and implementing mathematical operations efficiently.
2. Pandas
Pandas is a powerful library for data manipulation and analysis, designed to handle structured data efficiently. It allows users to clean, transform, and analyze large datasets with minimal effort. Building pandas projects will surely be the most fun thing you’ll do with Python. Try it now.
Key Features:
- DataFrame and Series objects for structured data handling
- Data cleaning (handling missing values, duplicate removal, type conversion)
- Data aggregation and group operations
- Efficient file handling (CSV, Excel, SQL, JSON, etc.)
Use Case: Pandas is essential in data preprocessing, exploratory data analysis (EDA), and feature engineering. It helps transform raw data into meaningful insights before feeding it into machine learning models.
3. Matplotlib & Seaborn (Visualization Libraries)
Matplotlib is a foundational visualization library that allows data scientists to create static, animated, and interactive plots. It is highly customizable and supports various chart types. Seaborn, on the other hand, is built on Matplotlib and provides statistical data visualization with a more aesthetic and intuitive interface. Knowing matplotlib is the very foundation all data science careers stand on, hence this is a must-know all the way and will always be the first step into data science.
Key Features:
- Matplotlib:
- Line, bar, scatter, histogram, and pie charts
- Object-oriented plotting for precise control
- Customizable styling, legends, and annotations
- 3D plotting capabilities
- Line, bar, scatter, histogram, and pie charts
- Seaborn:
- Predefined themes for better-looking plots
- Advanced statistical plots like violin plots, heatmaps, pair plots, and box plots
- Automatic handling of data aggregation and smoothing
- Predefined themes for better-looking plots
Use Case: Both libraries are widely used in data exploration and storytelling. Matplotlib is preferred for detailed customization, while Seaborn is ideal for creating publication-ready statistical visualizations quickly.
4. Scikit-Learn
Scikit-Learn is the go-to library for machine learning in Python, providing efficient tools for data mining, model building, and evaluation. It is widely used for both supervised and unsupervised learning tasks. Basically, if someone even knows what machine learning is, they know how to work with scikit-learn.
Key Features:
- Pre-built algorithms for classification, regression, clustering, and dimensionality reduction
- Model selection and hyperparameter tuning (GridSearchCV, RandomizedSearchCV)
- Feature selection and preprocessing (standardization, encoding, missing value handling)
- Integration with NumPy and Pandas for seamless data manipulation
Use Case: Scikit-Learn is used to build predictive models in fields like finance, healthcare, and marketing. For example, it helps detect fraudulent transactions, predict customer churn, and classify medical conditions based on data.
5. TensorFlow & PyTorch (Deep Learning Libraries)
TensorFlow and PyTorch are the most popular deep learning frameworks for building neural networks and AI applications. While TensorFlow is widely used in production environments, PyTorch is preferred for research and experimentation due to its dynamic nature. You should build a project with these libraries at least once, you’ll see many new doors open for your career.
Key Features:
- TensorFlow:
- Scalable deep learning models with TensorFlow 2.0 and Keras API
- Efficient model training with GPU/TPU acceleration
- TensorBoard for visualization and model monitoring
- Scalable deep learning models with TensorFlow 2.0 and Keras API
- PyTorch:
- Dynamic computation graphs for flexibility
- Strong support for research and academic use
- Easy debugging and intuitive API
- Dynamic computation graphs for flexibility
Use Case: These libraries power deep learning applications like computer vision, natural language processing (NLP), and reinforcement learning. For example, they are used in self-driving cars, speech recognition, and AI-driven medical diagnosis.
Python’s libraries keep getting better, with new tools coming out to solve specific data science problems. The strong community behind these libraries means they keep improving. As you learn more about data science, knowing these key libraries will help you tackle bigger challenges.
Python Roadmap for Data Science
Python data science requires a structured approach. A strategic roadmap helps you build skills step by step instead of following random tutorials. Let’s plan your trip from Python basics to advanced data science skills.
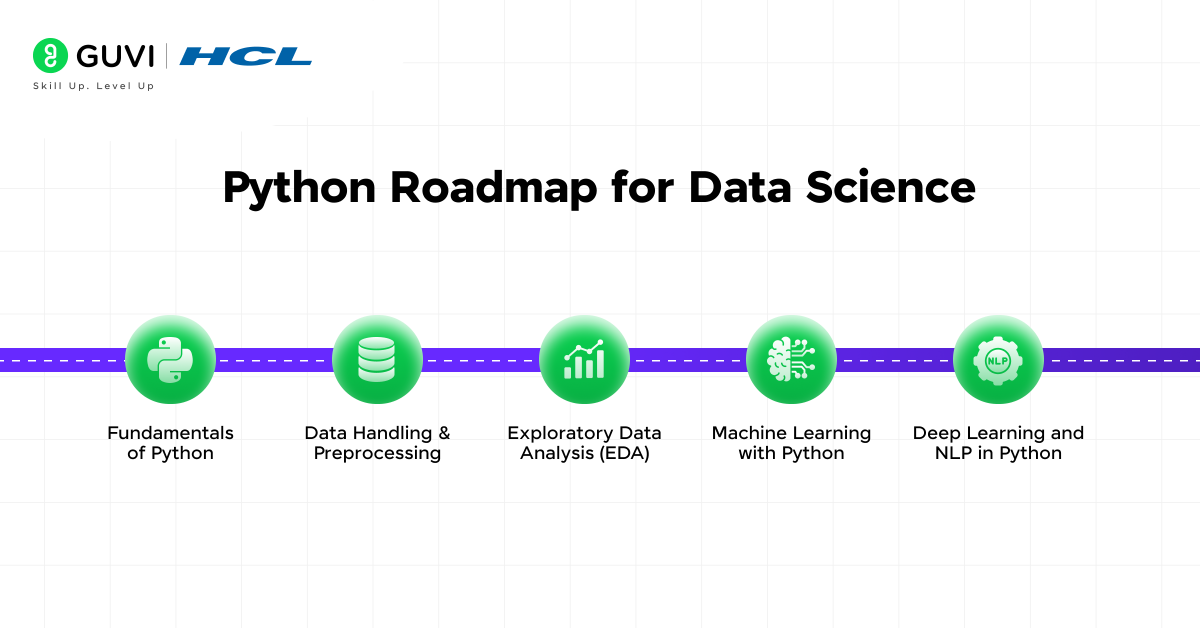
1) Fundamentals of Python
The fundamentals are your gateway to data science. You need to learn Python’s core concepts before you dive into specialized data science tools. Follow these steps:
- Start with Python’s simple syntax and data structures. These have variables, data types (integers, floats, strings, booleans), lists, tuples, sets, and dictionaries. Learn control structures like loops and conditional statements that help you direct program flow based on conditions.
- Functions are the building blocks of modular code. Learn to define functions, pass arguments, and return values. Python’s object-oriented programming features—classes, objects, inheritance, and polymorphism—are the foundations of many data science libraries.
- Error handling gets overlooked by beginners, but it’s vital when working with ground data. Try/except blocks help you write code that won’t crash with unexpected inputs.
- Interactive platforms like Codecademy, Datacamp, or Coursera offer structured Python courses to start with. Python’s documentation also becomes a great reference once you learn the basics.
- Practice brings proficiency. Challenge yourself with small projects that strengthen these fundamentals before you move to data science tools.
2) Data Handling & Preprocessing
Data is the backbone of data science, and working efficiently with structured and unstructured datasets is essential. Data scientists spend 80% of their time preparing data. Data handling and data preprocessing skills are key to career success. Let’s see what you must learn:
- Loading, Cleaning, and Transforming Data: Use pandas to read, clean, and manipulate datasets. Learn functions like read_csv(), dropna(), fillna(), and groupby() to preprocess large datasets.
- Handling Missing Values & Feature Engineering: Learn imputation techniques (mean, median, mode, KNN imputer), encoding categorical variables (one-hot encoding, label encoding), and feature selection techniques.
- Scaling and Normalization: Use Scikit-learn‘s StandardScaler, MinMaxScaler, and RobustScaler to normalize data for better model performance.
- Working with Large Datasets: Leverage Dask and Apache Spark (PySpark) for handling big data efficiently.
3) Exploratory Data Analysis (EDA)
EDA connects data preprocessing to modeling. It shows patterns and relationships before you apply machine learning algorithms. It basically helps uncover patterns, detect anomalies, and understand the structure of your data. And what you must learn is:
- Descriptive Statistics: Use describe(), value_counts(), and corr() in pandas to summarize and analyze datasets.
- Data Visualization: Use Matplotlib and Seaborn for histograms, scatter plots, box plots, and pair plots to detect trends and outliers.
- Hypothesis Testing: Learn statistical techniques like t-tests, chi-square tests, and ANOVA to validate assumptions and derive meaningful insights.
4. Machine Learning with Python
Once data is processed, machine learning enables predictive analytics and automation. Here’s what you must learn:
- Supervised Learning (Prediction & Classification)
- Regression Models: Learn Linear Regression, Ridge/Lasso Regression, and Decision Trees for predicting numerical values.
- Classification Models: Explore Logistic Regression, Support Vector Machines (SVM), Random Forests, and Gradient Boosting (XGBoost, LightGBM, CatBoost) for binary and multi-class classification.
- Unsupervised Learning (Clustering & Dimensionality Reduction)
- Clustering Algorithms: Implement K-Means, DBSCAN, and Hierarchical Clustering for pattern recognition.
- Dimensionality Reduction: Use Principal Component Analysis (PCA), t-SNE, and UMAP to reduce dataset complexity while preserving meaningful features.
5. Deep Learning and NLP in Python
Deep Learning and Natural Language Processing (NLP) are two of the most impactful fields in data science, and Python provides powerful libraries to implement them efficiently. In 2025, advancements in AI, transformer models, and generative AI are making deep learning even more accessible and scalable.
- Deep Learning with TensorFlow & PyTorch: TensorFlow and PyTorch are the two leading frameworks for building deep learning models. TensorFlow 2.x is known for its production-ready capabilities and integration with TensorFlow Serving, while PyTorch is favored for its ease of use and dynamic computation graph. Both support GPU acceleration, making them essential for deep learning applications.
- Building Neural Networks: Python provides Keras (on top of TensorFlow) for quickly building neural networks. A typical deep learning workflow involves:
- Defining the architecture: Using layers like Dense (fully connected), Convolutional (CNNs for images), and Recurrent (RNNs for sequential data).
- Training models: Using backpropagation and optimization techniques like Adam or RMSprop.
- Evaluating performance: Using accuracy, loss functions, and metrics like precision-recall.
- Defining the architecture: Using layers like Dense (fully connected), Convolutional (CNNs for images), and Recurrent (RNNs for sequential data).
- Transformers & Generative AI: NLP has been revolutionized by transformer models like GPT-4, BERT, and LLaMA. Libraries like Hugging Face’s Transformers allow easy implementation of state-of-the-art NLP models for text classification, question answering, and summarization. spaCy and NLTK remain key for traditional NLP tasks such as tokenization, named entity recognition (NER), and text preprocessing.
With this roadmap, you’ll have mastered all you need to know as a beginner in Python for data science. Do follow along closely, never give up and reach out to me in the comments section if you have any doubts whatsoever.
If you’re serious about mastering Python for data science and launching a career as a Data Scientist, then GUVI’s Data Science Course is the perfect choice. This industry-focused course offers hands-on training in Python, machine learning, deep learning, and real-world projects, ensuring you’re job-ready.
Concluding Thoughts…
Python stands as the dominant programming language in data science today. Its robust libraries, strong community backing, and applications in a variety of industries make it the perfect starting point for your data science journey.
This piece presents a well-laid-out learning path that helps you dodge common mistakes as you build expertise step by step. Each concept builds on what you’ve learned before and creates a strong base to solve complex data science problems.
Learning Python for data science now puts you in a great position to grab upcoming opportunities. Data science positions are set to grow by 36% through 2031, showing excellent career potential as companies increasingly base decisions on analytical insights.
FAQs
While learning timelines vary, most people can grasp Python basics in a few months of consistent study. Becoming proficient in data science applications usually takes 6-12 months of dedicated learning and practice.
The key libraries include Pandas for data manipulation, NumPy for numerical computing, Matplotlib and Seaborn for visualization, and Scikit-learn for machine learning. TensorFlow and PyTorch are crucial for deep learning applications.
While a basic understanding of statistics and linear algebra is helpful, you don’t need to be a math expert to start. Many Python libraries abstract complex mathematical operations, allowing you to focus on applying data science concepts.
Work on real-world projects, participate in Kaggle competitions, contribute to open-source projects, and build a portfolio on GitHub. Practical application of skills is crucial for mastering Python in data science.
While certifications can demonstrate your skills, they’re not always necessary. Employers often value practical experience and a strong project portfolio more than certifications. Focus on building real-world skills and showcasing your work through projects.


![What is the Difference Between BI and Data Science? [2025 Beginner's Guide] 10 difference between bi and data science](https://www.guvi.in/blog/wp-content/uploads/2025/06/Difference-Between-BI-and-Data-Science_.png)



Did you enjoy this article?