


Data Science Articles
Accountant vs Data Analyst Salary in India After Switching Careers - Best Guide
Finance Managers: Could Data Science Be Your Next Career Move?
Insurance Claims Executive to Data Analyst: Is It a Good Switch?
Banking Executive (Loans, KYC) to Data Analyst: Skills and Career Path


Get In Touch For Details! Request More Information
Data Transformation in Data Science: Types, Steps & Python Examples (2026)
Oct 12, 2026 6 Min Read 10700 Views
(Last Updated)
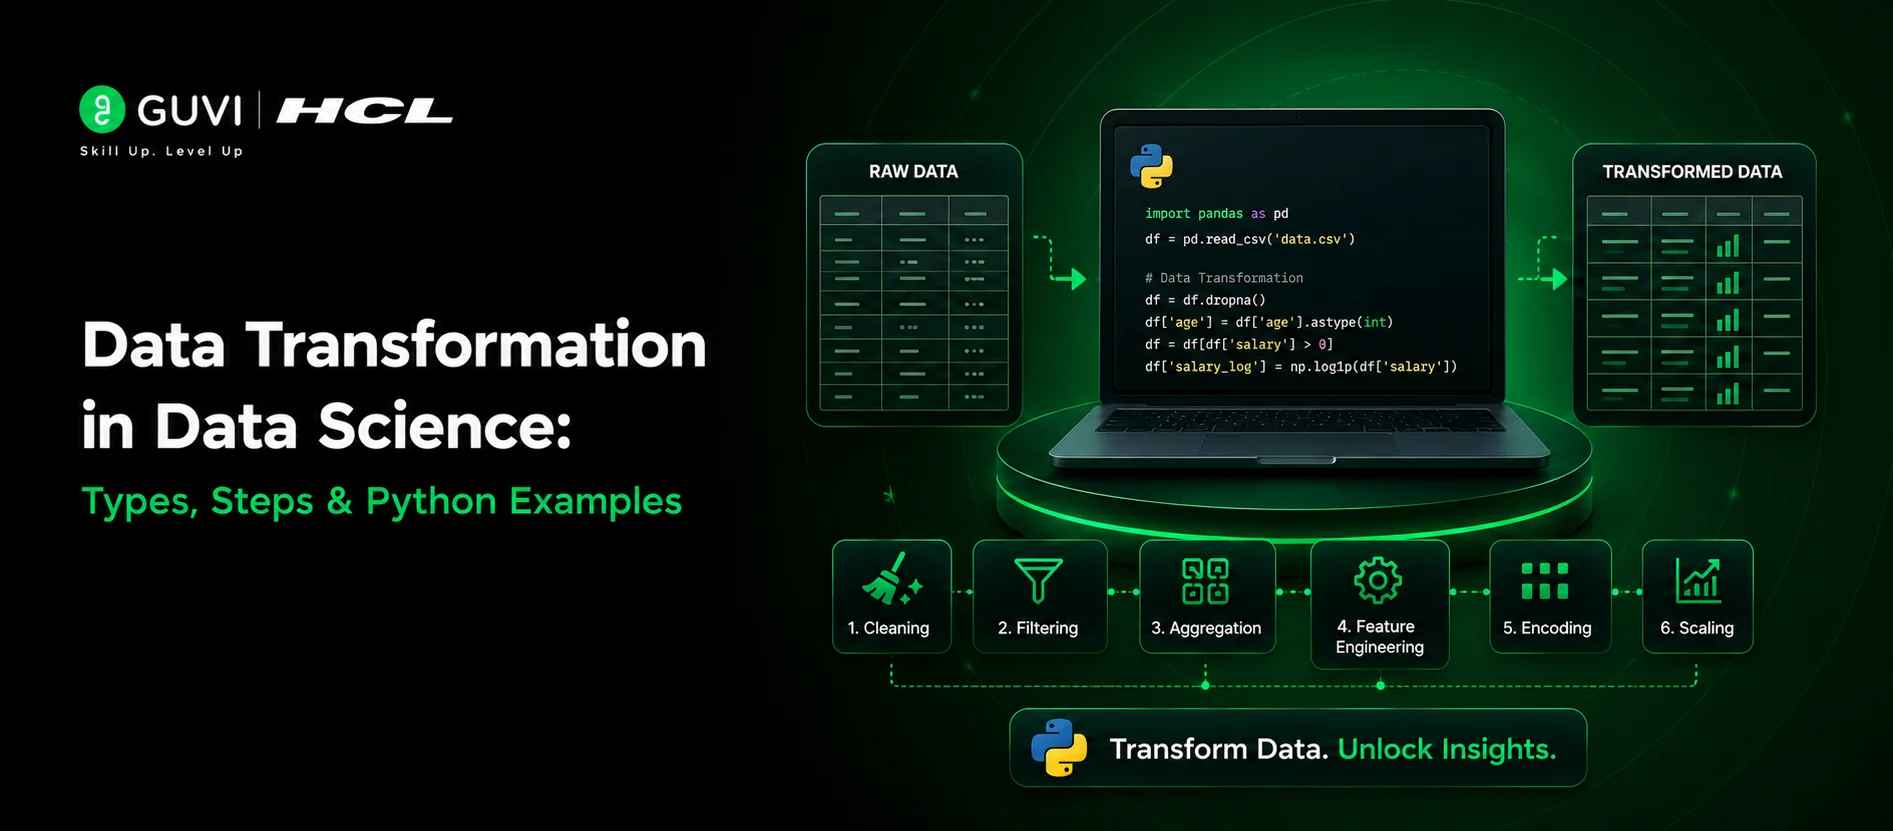
Data rarely arrives in a form that is ready for analysis. It may contain missing values, inconsistent formats, skewed distributions, or features measured on completely different scales. This is where data transformation in data science becomes essential.
Data transformation converts raw data into a cleaner and more useful format for analysis, visualization, and machine learning. In this blog, you will learn the main types of data transformation, the step-by-step process, common techniques, and practical Python examples to understand how it works in real-world data science workflows.
Table of contents
- Quick Answer
- What is Data Transformation?
- Key Components
- Data Transformation vs Data Cleaning vs Data Preprocessing
- Types of Data Transformation
- Transformation Techniques: When to Use What
- Step-by-Step Data Transformation Process in Data Science
- Python Examples: Normalization, Standardization & Log Transform
- Data Transformation in ETL Pipelines: A Data Engineering View
- Batch vs Real-Time Data Transformation
- When NOT to Transform Data: A Common Mistake
- Common Mistakes to Avoid in Data Transformation
- Data Transformation Interview Questions for Data Science Roles
- Beginner-Level Data Transformation Interview Questions
- Intermediate-Level Data Transformation Interview Questions
- Advanced-Level Data Transformation Interview Questions
- Conclusion
- FAQs
- What are the types of data transformation?
- Is normalization the same as standardization?
- Do all machine learning models need data transformation?
- What's the difference between ETL and ELT transformation?
- Can I reverse a data transformation?
- What's the biggest mistake beginners make with data transformation?
Quick Answer
Data transformation in data science is the process of converting raw data into a cleaner, consistent, and analysis-ready format.
In simple terms, it usually involves:
- Cleaning missing, duplicate, or inconsistent data.
- Scaling and normalizing numerical features.
- Encoding categorical variables into machine-readable values.
- Transforming skewed data using log, power, or other techniques.
- Preparing features so data performs better in analysis and machine learning models.
What is Data Transformation?

Data transformation is the process of converting raw data into a format that’s consistent, structured, and ready for analysis. You’ll rarely get data in a usable state straight from its source, so this step sits right between data collection and analysis in almost every data science workflow.
Think of it as prepping ingredients before you cook. The data itself doesn’t change in meaning, but its shape, scale, or structure does, so your models and dashboards can actually work with it.
Key Components
The data transformation process involves several key components:
- Data Cleaning: This involves removing duplicates, correcting errors, and handling missing values.
- Data Standardization: Ensuring consistency across different data sources and formats.
- Data Validation: Verifying the accuracy and integrity of the data.
- Data Structuring: Organizing the data into a format that’s suitable for analysis.
These components work together to convert raw data into a form that’s ready for use in your data warehouse or analytics platform.
Data Transformation vs Data Cleaning vs Data Preprocessing
Data transformation, data cleaning, and data preprocessing are often used together, but they are not the same process. Understanding the difference is important when designing a reliable data science preprocessing pipeline.
- Data Cleaning: Data cleaning focuses on fixing data quality problems. It includes removing duplicates, correcting invalid entries, handling missing values, and resolving inconsistent formats.
- Data Transformation: Data transformation changes the representation, scale, structure, or distribution of existing data. Common examples include normalization, standardization, encoding, log transformation, and aggregation.
- Data Preprocessing: Data preprocessing is the broader process of preparing raw data for analysis or machine learning. It can include both data cleaning and data transformation along with feature selection, feature engineering, and data splitting.
- Main Difference: Cleaning asks, “Is the data correct?” Transformation asks, “Is the data in the right form?” Preprocessing combines these activities to make the complete dataset model-ready.
- How They Work Together: A typical workflow first cleans inaccurate or incomplete records, then transforms features into suitable formats, and finally prepares the complete dataset for training, validation, or analysis.
Types of Data Transformation

Data transformation can be categorized into four main types:
- Constructive: Adding, copying, or replicating data.
- Destructive: Deleting unnecessary records or fields.
- Esthetic: Standardizing values to meet specific requirements or parameters.
- Structural: Reorganizing the database by renaming, moving, or combining columns.
Each type serves a specific purpose in the transformation process, helping
Transformation Techniques: When to Use What
Once your data is clean and structured, you’ll usually need to scale or reshape numeric values before feeding them into a model. Here’s how the most common techniques compare.
| Transformation Type | When to Use | Python Function | Before/After Example |
|---|---|---|---|
| Normalization (Min-Max) | Distance based models like KNN, K-Means, neural networks | MinMaxScaler() | Age 45 to 55 becomes 0.0 to 1.0 |
| Standardization (Z-score) | Linear regression, SVM, logistic regression, PCA | StandardScaler() | Salary 45,000 becomes -0.32 |
| Log Transformation | Right skewed data like income, price, or web traffic counts | np.log1p() | Income 5,00,000 becomes 13.12 |
| Robust Scaling | Data with heavy outliers | RobustScaler() | A stray 99,999 no longer dominates the whole range |
| One Hot Encoding | Categorical variables for most ML models | pd.get_dummies() | City “Chennai” becomes a 0/1 column |
Step-by-Step Data Transformation Process in Data Science
A structured data transformation process helps ensure that raw data becomes consistent, usable, and suitable for analysis or machine learning. The exact workflow may vary by project, but most data science pipelines follow these core steps:
- 1. Profile the Raw Data: Start by checking data types, missing values, duplicate records, unusual ranges, category counts, and feature distributions. Data profiling helps identify which variables actually need transformation.
- 2. Define the Transformation Goal: Decide what the transformed data needs to support. A dataset prepared for visualization may require different transformations from one used for machine learning or statistical modelling.
- 3. Handle Data Quality Issues: Correct inconsistent formats, missing values, duplicate records, and invalid entries before applying mathematical transformations. Poor-quality input can make later transformations unreliable.
- 4. Select the Right Transformation Technique: Choose normalization, standardization, encoding, log transformation, binning, aggregation, or another technique based on the feature type and intended algorithm.
- 5. Fit Transformations on Training Data: For machine learning projects, calculate scaling parameters, encoding rules, and other learned transformations using only the training dataset to prevent data leakage.
- 6. Apply and Validate the Transformation: Compare data before and after transformation. Check distributions, ranges, data types, missing values, and model performance to confirm that the transformation achieved its purpose.
- 7. Reuse the Same Transformation Pipeline: Apply identical transformation rules to validation, test, and production data. This keeps feature definitions consistent throughout the machine learning lifecycle.
Python Examples: Normalization, Standardization & Log Transform
Here’s how the three most common numeric transformations look in practice with scikit-learn.
import numpy as np
import pandas as pd
from sklearn.preprocessing import MinMaxScaler, StandardScaler

df = pd.DataFrame({'income': [25000, 48000, 52000, 61000, 250000]})

# Normalization: rescales values between 0 and 1
minmax = MinMaxScaler()
df['income_normalized'] = minmax.fit_transform(df[['income']])

# Standardization: centers data at mean 0, std deviation 1
standard = StandardScaler()
df['income_standardized'] = standard.fit_transform(df[['income']])

# Log Transformation: compresses right-skewed values like income
df['income_log'] = np.log1p(df['income'])

print(df)
Notice the outlier value of 2,50,000. Normalization squashes everything else close to zero because of it, while log transformation handles that skew far more gracefully. This is exactly why picking the right technique matters more than picking any technique.
Data Transformation in ETL Pipelines: A Data Engineering View
If you’re working on the data engineering side, transformation isn’t just a preprocessing step. It’s the “T” in ETL and ELT, and it sits at the center of how data moves through your pipeline.
- In ETL, transformation happens on a separate server before the data is loaded into the warehouse. You get clean data at rest, but less flexibility later.
- In ELT, raw data loads first, and transformation happens inside the warehouse itself using SQL or tools like dbt.
Modern data stacks lean toward ELT because cloud warehouses like Snowflake and BigQuery can handle transformation at scale. Tools like Airflow, dbt, and Mage AI are commonly used to schedule and version these transformation jobs, so they run consistently every time new data lands.
Batch vs Real-Time Data Transformation
Data transformation can happen either in batches or continuously as new data arrives. The right approach depends on how quickly the transformed data needs to become available.
- Batch Data Transformation: Batch transformation processes large volumes of stored data at scheduled intervals. It is commonly used for daily reports, historical analysis, data warehouse updates, and periodic machine learning pipelines.
- Real-Time Data Transformation: Real-time or streaming transformation processes records as they are generated. It is useful when applications need transformed data within seconds or milliseconds.
- Processing Pattern: Batch systems collect data first and transform it later. Real-time systems continuously transform events as they move through the pipeline.
- Common Use Cases: Batch transformation suits financial reporting, customer segmentation, and monthly analytics. Real-time transformation is more appropriate for fraud detection, recommendation systems, IoT monitoring, and live dashboards.
- Technology Stack: Batch pipelines commonly use SQL, Pandas, Spark, dbt, and warehouse jobs. Real-time pipelines often rely on technologies such as Apache Kafka, Apache Flink, Spark Structured Streaming, or cloud streaming services.
- Choosing Between Them: Use batch transformation when latency is not critical and large datasets can be processed together. Choose real-time transformation when business decisions depend on continuously updated data.

When NOT to Transform Data: A Common Mistake
It’s tempting to scale or transform every numeric column by default. Don’t. Here’s when you should hold back:
- Tree-based models like Random Forest, Decision Trees, and XGBoost don’t need scaled features. Transforming here adds work without improving accuracy.
- Categorical IDs disguised as numbers, like customer ID or pincode, should never be normalized. They aren’t measuring a quantity.
- Interpretability matters: if stakeholders need to read raw values in a report, transforming too early makes the numbers meaningless to them.
Common Mistakes to Avoid in Data Transformation
Data transformation can improve data quality, but incorrect preprocessing can also distort the dataset and reduce model performance. These are some common mistakes to avoid:
- Applying Transformations Before Splitting the Data:
Scaling or normalization should be fitted only on the training data. Using the complete dataset first can cause data leakage and produce misleading model results. - Using the Same Transformation for Every Feature:
Different variables require different treatment. Numerical features may need scaling, while categorical features may require encoding. Applying one method everywhere can reduce useful information. - Ignoring Skewed Data:
Highly skewed variables can affect statistical analysis and some machine learning models. Log, square-root, or power transformations may help create a more balanced distribution. - Removing Outliers Without Understanding Them:
Not every extreme value is an error. Some outliers may represent important real-world cases, so they should be investigated before being removed or transformed. - Transforming Data Without Checking the Output:
Always compare the dataset before and after transformation. Check distributions, missing values, feature ranges, and data types to ensure the transformation produced the intended result. - Forgetting to Apply the Same Transformation to New Data:
The transformation used during model training must also be applied to validation, test, and future input data. Otherwise, the model may receive features in a different format and produce unreliable predictions.
Want to practice these concepts hands-on instead of just reading about them? HCL GUVI’s Data Science Course walks you through real transformation pipelines using Python, Pandas, and scikit-learn, with projects you can add straight to your portfolio.
Data Transformation Interview Questions for Data Science Roles
Beginner-Level Data Transformation Interview Questions
1. What is data transformation in data science?
What to cover in your answer:
- Definition of data transformation.
- Why raw data often needs transformation before analysis.
- Examples such as scaling, normalization, encoding, and log transformation.
- How transformation improves consistency and model readiness.
2. What is the difference between normalization and standardization?
What to cover in your answer:
- Normalization usually scales values to a fixed range such as 0 to 1.
- Standardization transforms data around a mean of 0 and standard deviation of 1.
- When each method is preferred.
- Examples of algorithms that are sensitive to feature scale.
3. Why is data transformation important in machine learning?
What to cover in your answer:
- Improves feature consistency.
- Helps algorithms process variables measured on different scales.
- Can reduce skewness and improve distributions.
- Supports better model convergence and performance.
4. What are some common types of data transformation?
What to cover in your answer:
- Scaling and normalization.
- Standardization.
- Categorical encoding.
- Log and power transformations.
- Binning and discretization.
- Aggregation and feature construction.
Intermediate-Level Data Transformation Interview Questions
5. When should you use log transformation?
What to cover in your answer:
- Use with positively skewed numerical data.
- Helps reduce the influence of extreme values.
- Can make multiplicative relationships easier to model.
- Mention that zero and negative values require additional handling.
6. How do you transform categorical variables for machine learning?
What to cover in your answer:
- One-hot encoding for nominal variables.
- Ordinal encoding for ordered categories.
- Target or frequency encoding for high-cardinality features.
- Risks such as dimensionality growth and data leakage.
7. How do you avoid data leakage during transformation?
What to cover in your answer:
- Split training and test data before fitting transformations.
- Fit scalers, encoders, and imputers only on the training set.
- Apply learned parameters to validation and test data.
- Use pipelines to maintain a consistent preprocessing workflow.
8. How would you handle highly skewed numerical features?
What to cover in your answer:
- Inspect the distribution first.
- Consider log, square-root, Box-Cox, or Yeo-Johnson transformations.
- Check whether outliers are genuine observations or errors.
- Compare model performance before and after transformation.
Advanced-Level Data Transformation Interview Questions
9. How do Box-Cox and Yeo-Johnson transformations differ?
What to cover in your answer:
- Both are power transformations used to reduce skewness.
- Box-Cox generally requires strictly positive values.
- Yeo-Johnson can handle zero and negative values.
- Both estimate a transformation parameter to improve distribution shape.
10. How can data transformation affect model interpretability?
What to cover in your answer:
- Transformed variables may no longer retain their original units.
- Coefficients can become harder to interpret directly.
- Inverse transformation may be required when presenting predictions.
- There is often a trade-off between model performance and interpretability.
11. How would you design a production-ready data transformation pipeline?
What to cover in your answer:
- Separate numerical and categorical transformations.
- Fit transformations only on training data.
- Use reproducible preprocessing pipelines.
- Handle unseen categories and missing values.
- Save transformation parameters for inference.
- Monitor whether incoming production data follows expected distributions.
12. How would you decide whether a transformation actually improved the model?
What to cover in your answer:
- Compare validation metrics before and after transformation.
- Examine feature distributions and outlier behaviour.
- Check training stability and convergence.
- Use cross-validation where appropriate.
- Avoid applying transformations only because they are commonly recommended.
Conclusion
Data transformation is what turns raw, inconsistent data into something your models can actually learn from. Whether you’re normalizing a skewed income column or deciding between ETL and ELT for a pipeline, the goal stays the same: make the data usable without distorting what it means.
Start by understanding your data’s distribution, pick the technique that matches your model, and always validate your results before moving forward. Get comfortable with normalization, standardization, and log transformation first. Everything else builds on these three.
FAQs
What are the types of data transformation?
Data transformation includes normalization, aggregation, filtering, enrichment, and conversion.
Is normalization the same as standardization?
Use it when your data is heavily right-skewed, such as income, price, or transaction counts, to make patterns easier for models to learn.
Do all machine learning models need data transformation?
No. Tree-based models like Random Forest and XGBoost are generally unaffected by feature scaling, while distance-based models like KNN need it.
What’s the difference between ETL and ELT transformation?
ETL transforms data before loading it into a warehouse, while ELT loads raw data first and transforms it inside the warehouse itself.
Can I reverse a data transformation?
Yes, for most scikit-learn scalers. MinMaxScaler and StandardScaler both support inverse_transform() to get back original values.
What’s the biggest mistake beginners make with data transformation?
Fitting a scaler on the entire dataset before splitting it into train and test sets, which leaks information and inflates model performance.
Success Stories

About the Author
Vaishali
I'm a seasoned writer with four years of experience across technical, non-technical, and just about every genre or niche you can imagine. Adaptable and curious, I enjoy exploring new topics and making information engaging and easy to understand. Fueled by a steady stream of tea, I approach each project with creativity, reliability, and genuine enthusiasm for storytelling.
View all posts by Vaishali
Connect with me @













Did you enjoy this article?