

Data Science Articles
What are Analytical Skills and How to Master them for 3X Career Growth?
Skills for Financial Data Analysis and Modeling: A Complete Guide
Skills to Become a Healthcare Data Analyst: A 2026 Career Guide


Get In Touch For Details! Request More Information
As you already know, data science is the unofficial governing body of every business out there. Without data insights, a business can’t withstand the heavy competition of the current age.
But how to find patterns and identify trends in the data? That’s where the key concept, Clustering in data science comes into the picture. This is an important factor that you shouldn’t miss when you are learning data science.
If you don’t know much about it, worry not, you are not alone as this article will guide you through the world of clustering in data science giving you invaluable knowledge on the domain!
So, without further ado, let us get started!
Table of contents
- TL;DR - Quick Summary
- Understanding Clustering in Data Science
- Clustering vs Classification vs Regression: What's the Difference?
- Why Clustering in Data Science Matters?
- Types of Clustering in Data Science
- 4 Key Techniques of Clustering in Data Science
- K-Means Clustering
- Hierarchical Clustering
- DBSCAN (Density-Based Spatial Clustering of Applications with Noise)
- Gaussian Mixture Models (GMM)
- How to Perform Clustering in Data Science: Step-by-Step Process
- Step 1: Data Collection & Understanding
- Step 2: Data Preprocessing
- Step 3: Choose the Right Algorithm
- Step 4: Determine the Number of Clusters (for K-Dependent Algorithms)
- Step 5: Fit the Algorithm and Evaluate Results
- Step 6: Interpret and Act on Clusters
- Best Practices for Clustering in Data Science
- Standardize Your Data
- Visualize Your Clusters
- Experiment with Different Algorithms
- Use Domain Knowledge
- Handle Outliers Carefully
- Evaluate and Validate Your Clusters
- Iterate and Refine
- Clustering in Data Science: Top Interview Questions & Answers
- Conclusion
- FAQs
- How does clustering differ from classification?
- How does the Silhouette Score help in clustering?
- What is the Expectation-Maximization algorithm in Gaussian Mixture Models?
- Can clustering algorithms be used for real-time data?
TL;DR – Quick Summary
Clustering is an unsupervised machine learning technique that groups similar data points together without using labelled data. The 4 major clustering algorithms are: K-Means (partition-based), Hierarchical (tree-based), DBSCAN (density-based), and GMM (probability-based). Clustering is used in customer segmentation, fraud detection, recommendation systems, medical imaging, and more. Python’s scikit-learn library makes all four algorithms easy to implement.
Understanding Clustering in Data Science

The best way to learn any new concept is to start from the definition. In the same way, let us now see the textbook definition of clustering in data science and understand its inference.
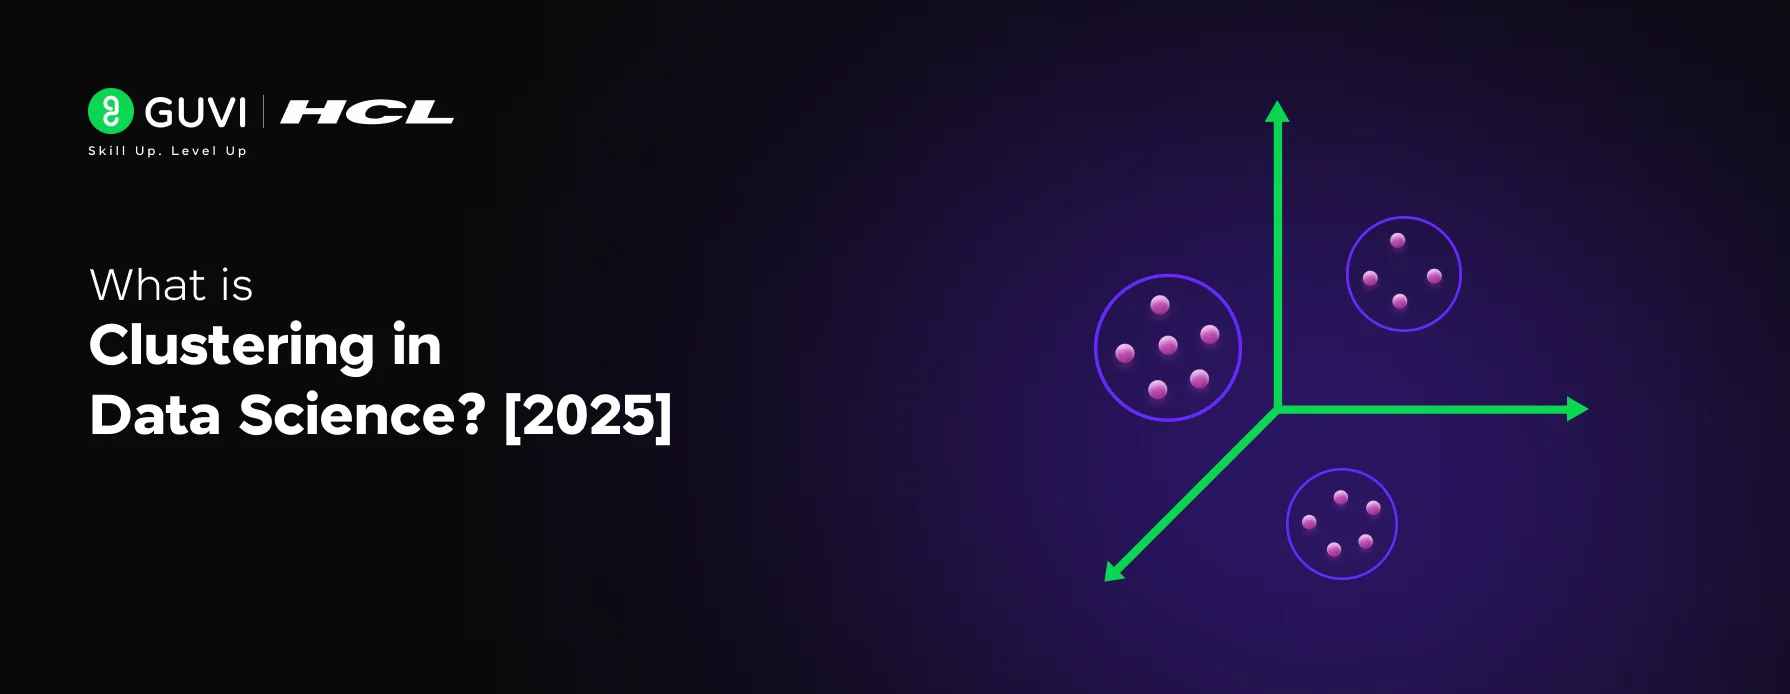
Clustering is a fundamental technique in data science, used for finding patterns and structures in data. It involves grouping a set of objects in such a way that objects in the same group (called a cluster) are more similar to each other than to those in other groups (clusters).
If you understand clustering in data science by the above definition, well and good but to truly grasp clustering, think about how you naturally group things in your daily life.
For example, when you organize your closet, you might group clothes by type: shirts, pants, and jackets. Within these categories, you might further group them by color or season. This process of grouping similar items together based on certain characteristics is exactly what clustering in data science is.
In the world of technology, clustering in data science is about finding these natural groupings in a dataset. Imagine you have a large set of customer data with various attributes like age, income, and purchasing behavior.
By applying clustering, you can discover which customers are similar in these aspects and group them together. This helps you understand your customers better and tailor your marketing strategies accordingly.
Clustering vs Classification vs Regression: What’s the Difference?
| Aspect | Clustering | Classification | Regression |
| Learning Type | Unsupervised | Supervised | Supervised |
| Labels Required? | No | Yes | Yes |
| Output | Groups/Clusters | Category labels | Continuous values |
| Goal | Discover patterns | Predict category | Predict a number |
| Example | Group customers by behaviour | Spam vs. Not Spam | Predict house price |
| Algorithm Examples | K-Means, DBSCAN, GMM | SVM, Decision Tree | Linear Regression |
Why Clustering in Data Science Matters?
Clustering in data science has numerous applications across various fields:
- Customer Segmentation: Businesses use clustering to group customers with similar behaviors, enabling targeted marketing strategies.
- Image Segmentation: In computer vision, clustering helps in dividing an image into regions for easier analysis and processing.
- Anomaly Detection: Identifying unusual patterns in data, which could indicate fraud or system failures.
- Social Network Analysis: Understanding community structures within social networks.
Types of Clustering in Data Science
Before diving into specific algorithms, it is important to understand the 5 major categories of clustering methods:
| Type | How It Works | Best Algorithms | When to Use |
| Partition-based | Divides data into K non-overlapping groups | K-Means, K-Medoids | Large datasets, known number of clusters |
| Hierarchical | Builds a tree of nested clusters | Agglomerative, Divisive | Exploratory analysis, unknown K |
| Density-based | Groups dense regions, ignores noise | DBSCAN, HDBSCAN | Irregular shapes, data with outliers |
| Model-based | Assumes data fits a statistical model | GMM, EM Algorithm | Soft/probabilistic cluster membership |
| Grid-based | Divides space into a grid structure | STING, CLIQUE | Very large spatial datasets |

4 Key Techniques of Clustering in Data Science

We finished the first step of understanding the definition of clustering in data science. Now it is time to learn the techniques that are used in clustering in data science.
It is imperative that you have a basic understanding of data science before going through this. If not, then consider enrolling for a professionally certified online Data Science course by a recognized institution that can help you get started and also provide you with an industry-grade certificate!
Let us now dive into some key techniques of clustering in data science that you might come across.
1. K-Means Clustering
- How it Works: Imagine you have a bunch of data points on a map. K-Means clustering helps you group these points into K clusters. Think of K as the number of groups you want. The algorithm finds K central points, called centroids, and then assigns each data point to the nearest centroid. After that, it adjusts the centroids and reassigns the points until things settle down.
- Why Use It: It’s straightforward and works well for large datasets.
- Things to Keep in Mind: You need to decide the number of clusters (K) beforehand, which can be tricky. Also, the results can vary depending on where the initial centroids are placed.
2. Hierarchical Clustering
- How it Works: This technique builds a tree of clusters. You start by treating each data point as its own cluster. Then, you repeatedly merge the closest pairs of clusters until you end up with a single cluster or a set number of clusters. There are two main types: agglomerative (bottom-up) and divisive (top-down).
- Why Use It: You don’t need to specify the number of clusters upfront, and it gives you a cool tree diagram (dendrogram) to visualize the clusters.
- Things to Keep in Mind: It can be slow and resource-intensive, especially with large datasets.
3. DBSCAN (Density-Based Spatial Clustering of Applications with Noise)
- How it Works: DBSCAN groups together points that are closely packed based on a distance metric. It starts with an arbitrary point and finds all points within a certain distance (epsilon). If there are enough points (minPts), it forms a cluster. If not, the point is marked as noise. This continues until all points are either clustered or marked as noise.
- Why Use It: It’s great for finding clusters of varying shapes and sizes and is robust to outliers (noise).
- Things to Keep in Mind: You need to set the distance (epsilon) and the minimum number of points (minPts), which can require some trial and error.
4. Gaussian Mixture Models (GMM)
- How it Works: Gaussian Mixture Models assume that your data is generated from a mix of several Gaussian distributions (bell curves). It uses the Expectation-Maximization (EM) algorithm to estimate the parameters of these distributions. Each cluster is represented by a Gaussian distribution, and the algorithm finds the best combination of these distributions to fit the data.
- Why Use It: It’s flexible and can model clusters of different shapes and sizes. Plus, it gives you probabilities for each point belonging to a cluster.
- Things to Keep in Mind: It’s more complex and computationally intensive than some other methods, and you still need to specify the number of clusters.
By understanding these key techniques of clustering in data science, you can choose the one that best fits your data and your specific problem. Each method has its strengths and weaknesses, so it’s often worth trying a few different approaches to see which one works best for you.
How to Perform Clustering in Data Science: Step-by-Step Process

Similar to the data science process, there is a process for clustering in data science that you need to follow!
Step 1: Data Collection & Understanding
Before clustering, understand what your data represents. Ask: How many rows and columns? What types of features (numerical, categorical, text)? Are there obvious outliers or anomalies?
- Use df.info(), df.describe(), and df.isnull().sum() in Python/Pandas
- Visualise distributions with histograms and box plots
Step 2: Data Preprocessing
Raw data is rarely ready for clustering. Preprocessing is often the most critical step.
| Issue | Impact on Clustering | Solution |
| Missing values | Most algorithms cannot handle NaN | Impute (mean/median) or remove rows |
| Different scales (e.g. age vs salary) | Large-scale features dominate distance | Standardise (StandardScaler) or normalise (MinMaxScaler) |
| Categorical features | Algorithms expect numbers | One-hot encode or use label encoding |
| Outliers | Skew centroids in K-Means | Remove, cap, or use DBSCAN which labels them as noise |
| High dimensionality | Distance becomes meaningless | Apply PCA or t-SNE before clustering |
Step 3: Choose the Right Algorithm
Decision guide: Large dataset + known K = K-Means. Unknown K + need to explore = Hierarchical. Irregular shapes + outliers = DBSCAN. Overlapping groups + soft membership = GMM.
Step 4: Determine the Number of Clusters (for K-Dependent Algorithms)
- Elbow Method: Plot WCSS vs K — choose K at the “elbow” of the curve
- Silhouette Analysis: Score from -1 to +1 — choose K with the highest average score
- Gap Statistic: Compares WCSS to a random reference distribution
- Domain Knowledge: If you know there are 5 product categories, start with K=5
Step 5: Fit the Algorithm and Evaluate Results
Run your chosen algorithm and evaluate cluster quality using these metrics:
| Metric | What It Measures | Range | Ideal Value |
| Silhouette Score | Cohesion vs separation of clusters | -1 to 1 | Close to +1 |
| Davies-Bouldin Index | Average similarity between clusters | 0 to ∞ | Lower is better (ideal: 0) |
| Calinski-Harabasz Score | Cluster compactness and separation | 0 to ∞ | Higher is better |
| WCSS / Inertia | Total within-cluster distance | 0 to ∞ | Lower is better |
| Adjusted Rand Index | Similarity to ground truth labels (if available) | -0.5 to 1 | Close to 1 |
Step 6: Interpret and Act on Clusters
The final step turns mathematical clusters into business decisions. For each cluster, calculate summary statistics and give it a descriptive name.
- Customer clusters: “High-Value Loyal”, “Price-Sensitive Occasional”, “New Potential”
- Patient clusters: “Low Risk”, “Moderate Risk — Monitor”, “High Risk — Immediate Intervention”
- Product clusters: “Fast-moving”, “Seasonal”, “Slow-moving — Consider Discounting”
Real-World Applications of Clustering in Data Science
| Industry | Application | Algorithm Typically Used |
| E-Commerce / Retail | Customer segmentation for targeted marketing | K-Means, GMM |
| Banking / Finance | Fraud detection and anomaly identification | DBSCAN, Isolation Forest |
| Healthcare | Patient risk stratification, gene expression analysis | Hierarchical, K-Means |
| Technology | Recommendation systems (Netflix, Spotify, Amazon) | K-Means, GMM |
| Computer Vision | Image segmentation, object detection | K-Means, DBSCAN |
| Marketing | Market basket analysis, campaign targeting | K-Means, Apriori |
| Urban Planning | Traffic pattern analysis, zone mapping | DBSCAN, Hierarchical |
| Cybersecurity | Network intrusion detection | DBSCAN, Isolation Forest |
If you don’t know already, Python is the best programming language for Data Science and in case your concepts are not very clear in Python and have the determination to improve, consider enrolling for HCL GUVI’s Self-Paced Python course that lets you learn in your way!
Best Practices for Clustering in Data Science

To get the most out of clustering in data science, here are some best practices you should follow. This is the last stop in our journey through the world of clustering in data science!
1. Standardize Your Data
- Make sure all your features (data points’ characteristics) are on a similar scale. This usually means normalizing or standardizing your data.
- Clustering algorithms often rely on distances between data points. If your data isn’t standardized, features with larger scales can dominate the clustering process, leading to misleading results.
2. Visualize Your Clusters
- After clustering, use visualization tools like scatter plots, dendrograms, and heatmaps to see your clusters.
- Visualizing helps you understand the structure of your clusters and can highlight any issues or patterns you might not see from just numbers.
3. Experiment with Different Algorithms
- Try multiple clustering algorithms to see which one works best for your data. Each algorithm has its own strengths and weaknesses.
- Different algorithms can produce different results. By experimenting, you can find the one that provides the most meaningful clusters for your specific problem.
4. Use Domain Knowledge
- Apply your understanding of the field or industry to interpret the clusters. Know what makes sense and what doesn’t in the context of your data.
- Domain knowledge can help you validate the clusters and ensure they make practical sense. It also helps in naming and understanding the clusters better.
5. Handle Outliers Carefully
- Identify and decide how to handle outliers in your data. Sometimes they can be removed, or you might need to use algorithms that can handle them well, like DBSCAN.
- Outliers can skew your clusters and lead to incorrect interpretations. Properly handling them ensures your clusters are accurate and meaningful.
6. Evaluate and Validate Your Clusters
- Use evaluation metrics like the Silhouette Score, Davies-Bouldin Index, or cross-validation methods to assess the quality of your clusters.
- Evaluation ensures that the clusters you’ve created are actually good and useful. It helps you refine the clustering process and improve your results.
7. Iterate and Refine
- Don’t settle on the first clustering result. Iterate by adjusting parameters, trying different algorithms, and refining your data preprocessing steps.
- Clustering is often an iterative process. Refining your approach can lead to better, more meaningful clusters.
By following these best practices, you’ll be better equipped to use clustering in data science effectively.
Clustering in Data Science: Top Interview Questions & Answers
1: What is the difference between clustering and classification?
A: Classification is a supervised technique that assigns data to pre-defined categories using labelled training data. Clustering is unsupervised — it discovers natural groupings in unlabelled data. Use classification when you know the output categories; use clustering to discover what those categories might be.
2: How does K-Means clustering work?
A: K-Means assigns N data points to K clusters by: (1) placing K random centroids, (2) assigning each point to the nearest centroid, (3) recalculating centroids as the cluster mean, and (4) repeating until convergence. The algorithm minimises the Within-Cluster Sum of Squares (WCSS).
3: What is the Silhouette Score and how is it used to evaluate clustering?
A: The Silhouette Score measures how similar each data point is to its own cluster compared to other clusters. It ranges from -1 (wrong cluster) to +1 (perfect fit). A score above 0.5 generally indicates good clustering. It is used to compare different K values or different algorithms on the same dataset.
4: When would you choose DBSCAN over K-Means?
A: Choose DBSCAN when: (1) clusters have irregular shapes (not spherical), (2) the number of clusters is unknown, (3) the data contains significant outliers that should be detected, (4) you are doing spatial data analysis or anomaly/fraud detection. K-Means assumes spherical clusters and is sensitive to outliers.
5: What is the Expectation-Maximisation (EM) algorithm in GMM?
A: EM is an iterative optimisation algorithm used in Gaussian Mixture Models. The E-step (Expectation) calculates the probability that each data point belongs to each Gaussian component. The M-step (Maximisation) updates the Gaussian parameters (mean, covariance, mixing weight) to maximise those probabilities. E and M repeat until convergence.
6: What is a dendrogram and how do you use it?
A: A dendrogram is a tree diagram produced by hierarchical clustering that shows how individual data points are progressively merged into clusters. To determine the number of clusters, draw a horizontal line across the dendrogram at a height that cuts through the fewest vertical lines — the number of lines crossed is your optimal K.
7: Can clustering algorithms be used on real-time streaming data?
A: Yes. Online K-Means (Mini-Batch K-Means) and streaming clustering algorithms like CluStream are designed for real-time data. They update cluster assignments incrementally as new data arrives, without reprocessing the entire dataset. Mini-Batch K-Means in scikit-learn is the most practical option for streaming workloads.
8: What is the Davies-Bouldin Index?
A: The Davies-Bouldin Index measures the average similarity ratio between each cluster and its most similar cluster. Lower values indicate better clustering (ideal = 0). Unlike the Silhouette Score, it does not require ground truth labels and is computed purely from the cluster structure.
If you want to learn more about Clustering in Data Science and its functionalities, then consider enrolling in HCL GUVI’s Certified Data Science Course which not only gives you theoretical knowledge but also practical knowledge with the help of real-world projects.
If you wish to explore more, have a look at the Future of Data Science!
Conclusion
In conclusion, clustering in data science is a powerful technique for finding patterns and structures within data. By following best practices like standardizing data, visualizing clusters, experimenting with different algorithms, and leveraging domain knowledge, you can make the most of this method.
Whether you’re segmenting customers, identifying anomalies, or exploring any dataset, clustering in data science provides valuable insights to inform better decisions.
FAQs
1. How does clustering differ from classification?
Clustering groups unlabeled data into clusters, while classification assigns labeled data into predefined categories.
2. How does the Silhouette Score help in clustering?
The Silhouette Score measures how similar a data point is to its own cluster compared to other clusters, helping to evaluate the quality of clusters.
3. What is the Expectation-Maximization algorithm in Gaussian Mixture Models?
The Expectation-Maximization algorithm iteratively estimates the parameters of the Gaussian distributions in GMM to fit the data.
4. Can clustering algorithms be used for real-time data?
Yes, some clustering algorithms like online K-Means and stream clustering are designed for real-time data processing.
Success Stories

About the Author
Lukesh S
A professional content writer who has experience in freelancing and now working as a Technical Content Writer at HCL GUVI having sound knowledge in Blog Writing and Creative Writing!
View all posts by Lukesh S
Connect with me @


Did you enjoy this article?