

Marketing Funnel and Campaign Analytics
Lesson 3: Marketing Funnel and Campaign Analytics
What is a marketing funnel?
A funnel describes the stages a person passes through on the way to becoming a customer.
Stage | Example event | Typical metric |
| Awareness | Sees an ad | Impressions, reach |
| Interest | Clicks the ad | Click-through rate (CTR) |
| Consideration | Visits the landing page | Bounce rate, time on page |
| Conversion | Signs up / buys | Conversion rate |
| Retention | Returns, renews | Repeat-purchase rate |
| Advocacy | Refers others | Referral rate |
Measuring each stage shows where potential customers drop off.
Conversion rate
Conversion rate = conversions ÷ eligible opportunities × 100
The denominator must be clear:
Denominator | Gives |
| Users | Share of people who convert |
| Sessions | Share of visits that convert (users with many visits lower the rate) |
| Clicks | Share of ad clicks that convert |
| Leads | Share of leads that become customers |
These are not interchangeable. Always state which one you used.
Example
Stage | Count | Step conversion |
| Impressions | 100,000 | – |
| Clicks | 2,000 | 2.0% (CTR) |
| Landing page visits | 1,800 | 90% |
| Sign-ups | 100 | 5.6% |
| Purchases | 25 | 25% |
- Overall impression-to-purchase rate: 25 ÷ 100,000 = 0.025%
- The biggest absolute drop is impressions → clicks; the step conversion rates show where improvements may have the most effect.
From the original example: if 2,000 visitors arrive and 100 sign up, the visitor-to-signup conversion rate is 5%. If a campaign brings more visitors but the same number sign up, traffic has increased without improving conversion.
Compare campaigns carefully
Metric | Formula | Question it answers |
| CTR | Clicks ÷ impressions | Is the ad attracting attention? |
| CPC | Spend ÷ clicks | How much does each click cost? |
| CPA / CAC | Spend ÷ new customers | How much does each customer cost? |
| ROAS | Revenue ÷ ad spend | How much revenue per ₹1 spent? |
| Conversion rate | Conversions ÷ visitors | Does traffic turn into customers? |
| Retention of acquired users | Share still active after N days | Are these quality customers? |
Attribution decides which channel gets credit when customers interact with several:
Model | Credit goes to |
| Last-click | The final touchpoint before conversion |
| First-click | The first touchpoint |
| Linear | All touchpoints equally |
| Data-driven | Touchpoints weighted by a statistical model |
Different models can rank the same campaigns differently. Check which model your analytics platform uses.
Common mistakes
- High CTR ≠ valuable customers. Clickbait ads attract low-intent users.
- Comparing campaigns over different periods or seasons.
- Ignoring budget and audience differences.
- Ignoring tracking gaps (ad blockers, cookie consent, cross-device journeys).
- Judging only short-term conversions without looking at retention or lifetime value.
Try it: Create a simple funnel with impressions, clicks, visits, and signups. Calculate the conversion rate between each consecutive stage.
Data Analytics Tutorial

Recommended Handbooks

C++ Handbook

Python Basics Handbook

Javascript Handbook

Building a Random Joke Generator Using ReactJS

Build a Character Counter in React JS

Build Your QR Code Generator using React JS

Build a Birthday Reminder App using React JS

Building BMI Calculator Using ReactJS
Building Random Password Generator using ReactJS
Temperature Converter Project in React
Building a To-Do List App Using ReactJS
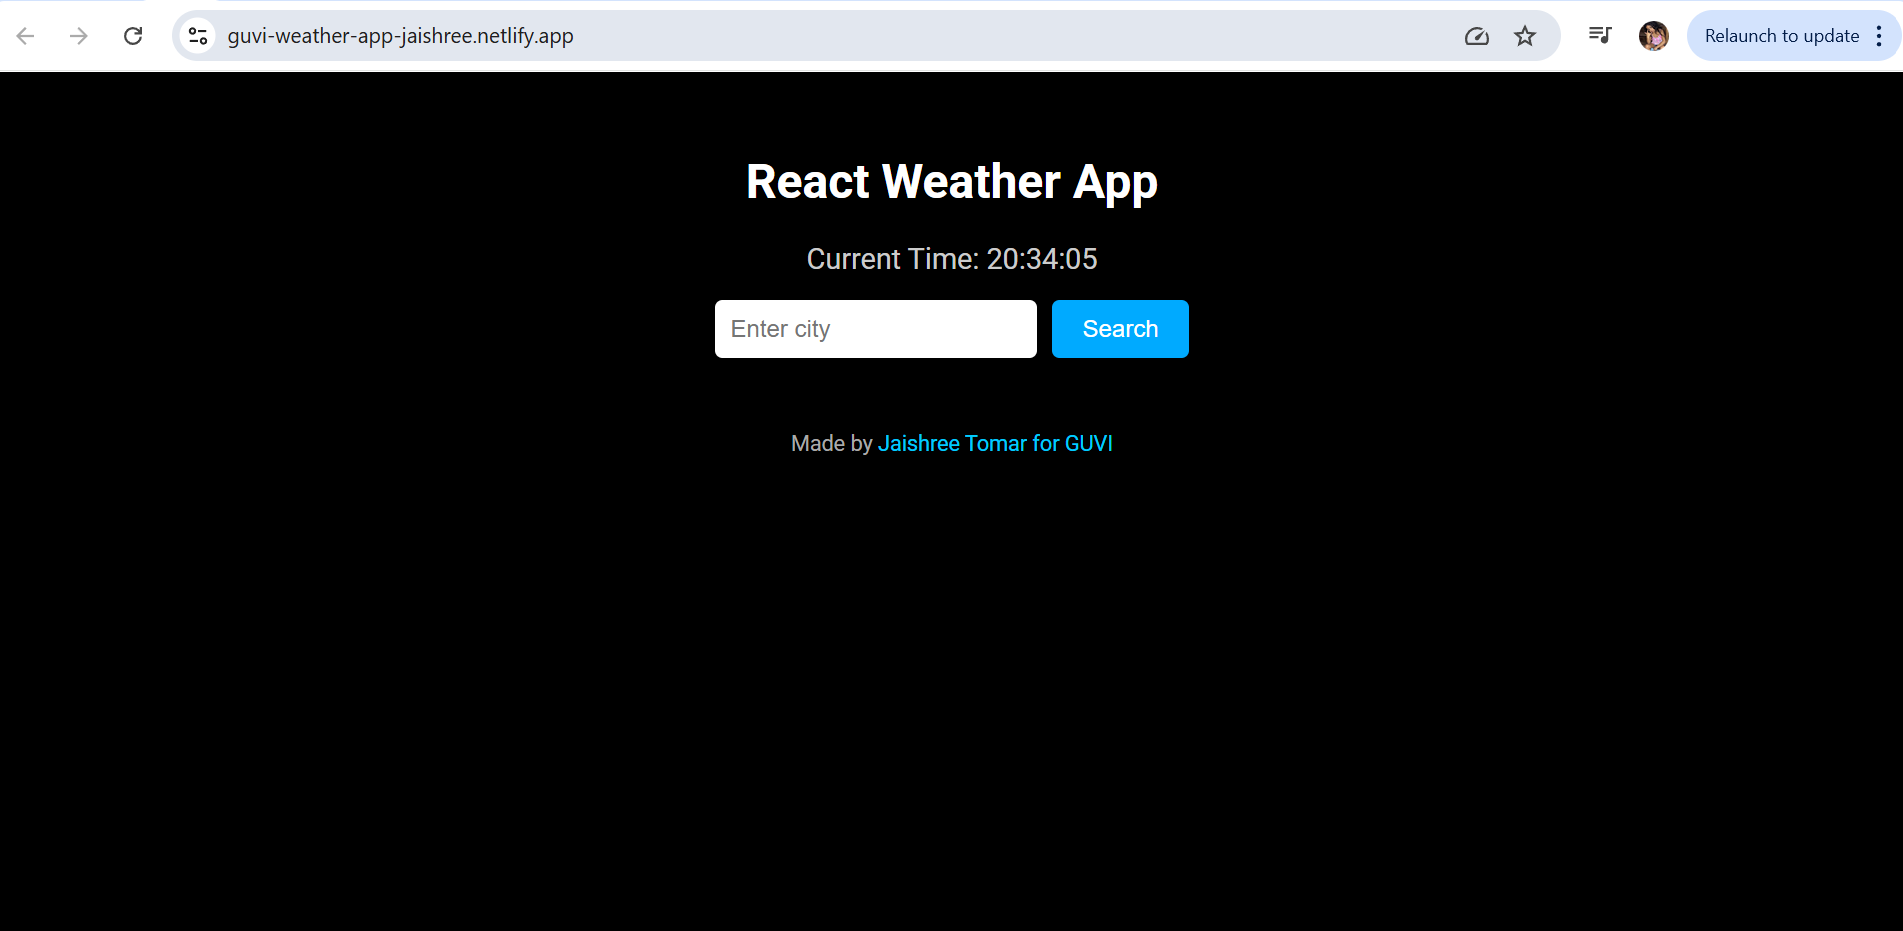
Building a Weather App Project Using ReactJS
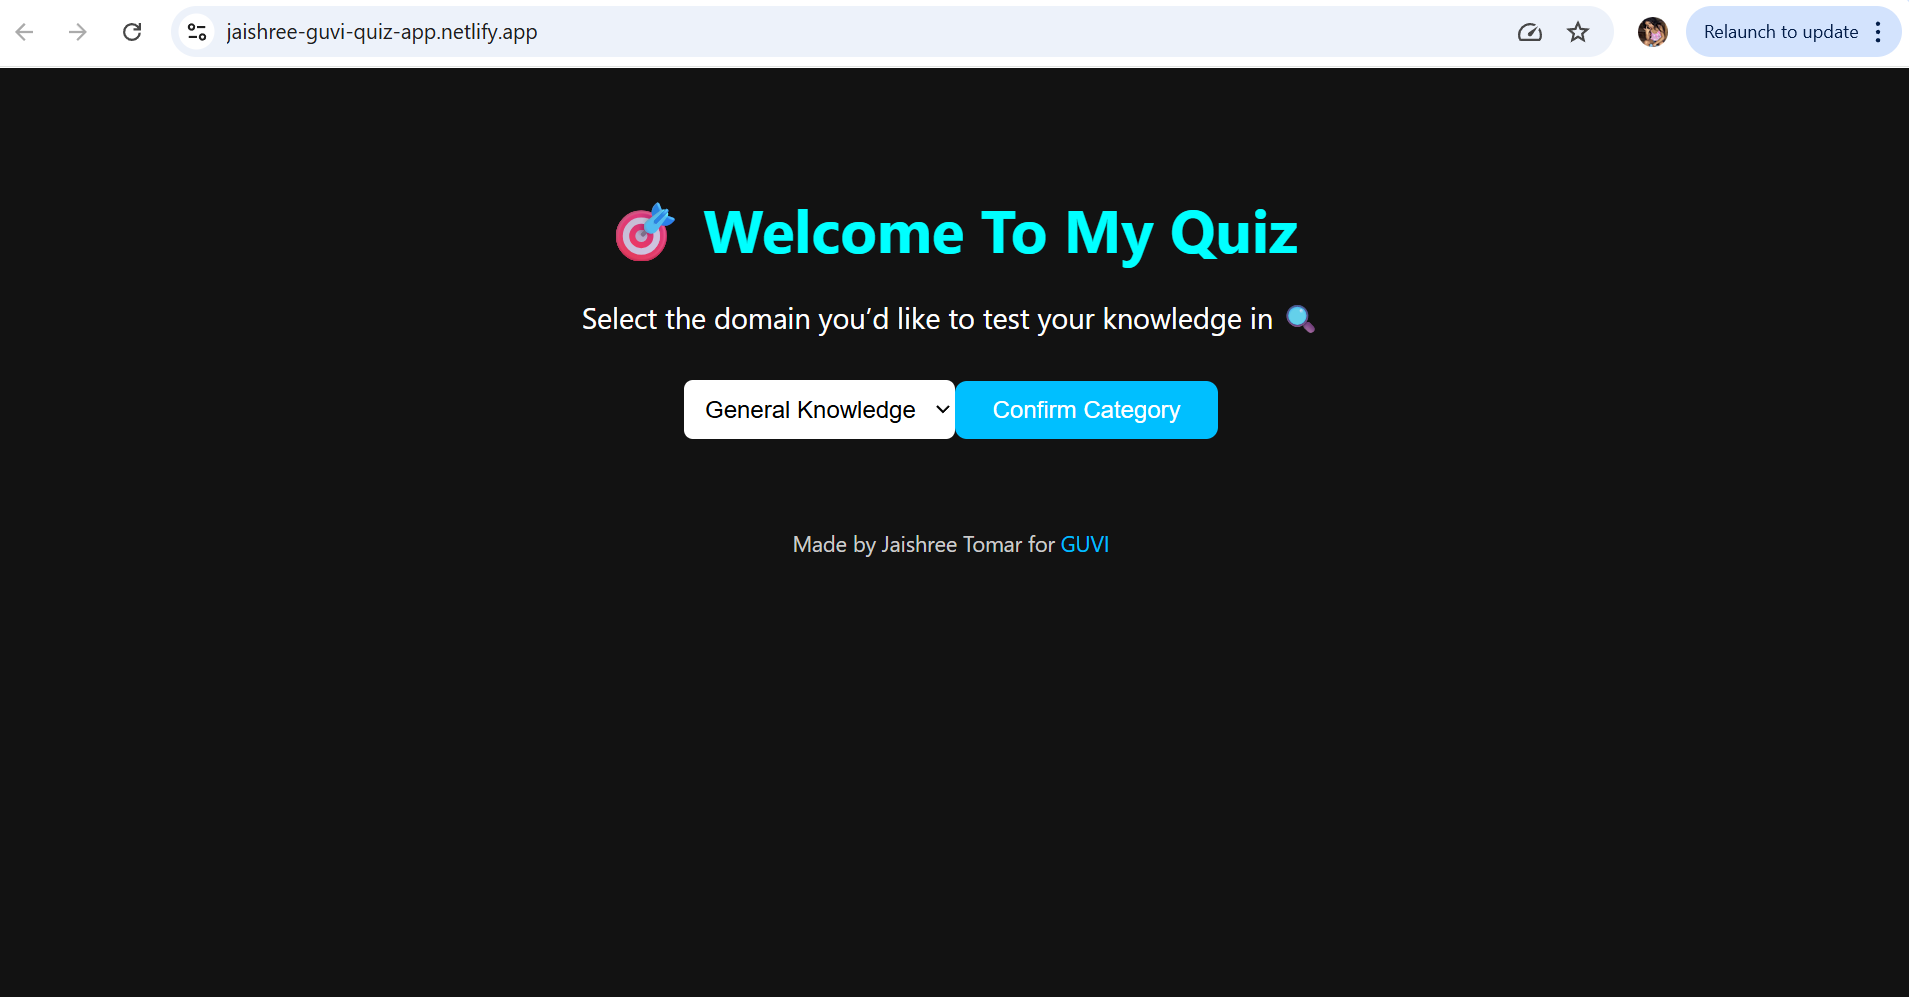
Building a Quiz App in ReactJS
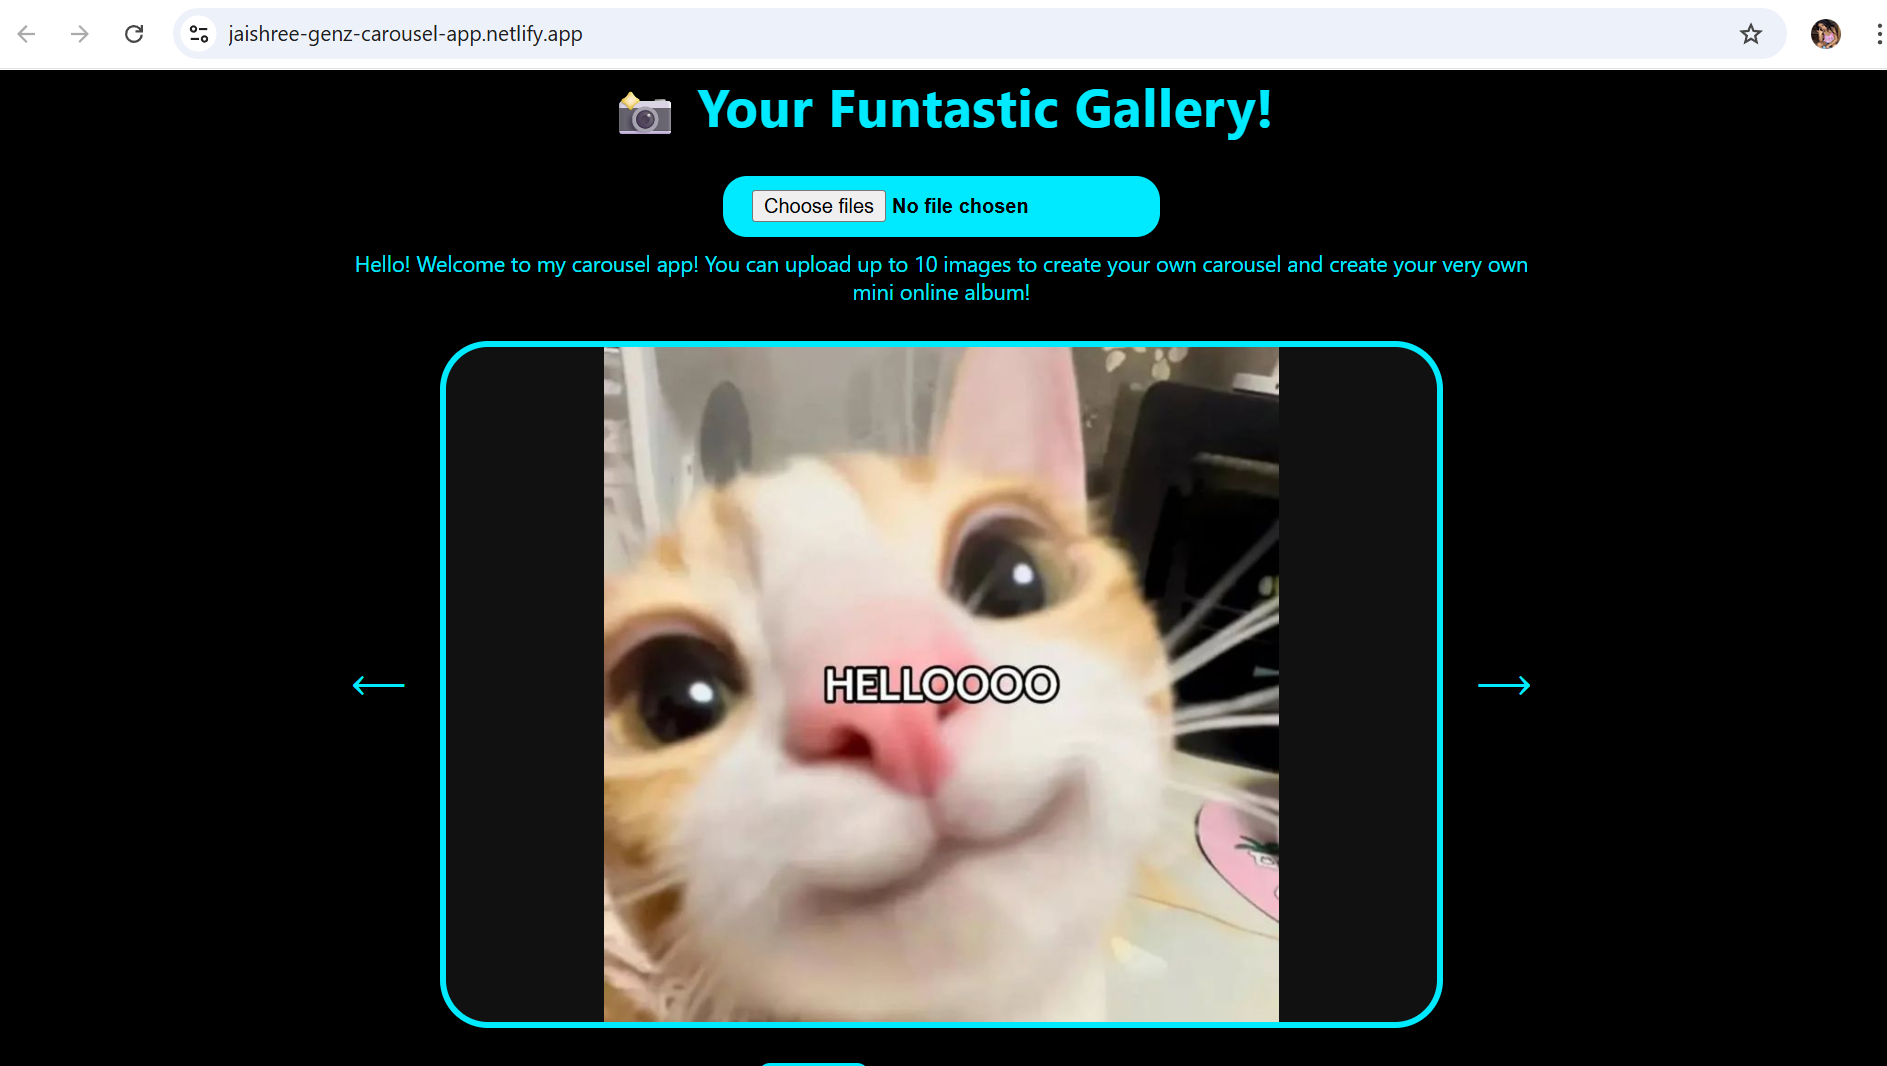
Building a GenZ Carousel App in React

ReactJS Projects Handbook

Computer Networks Tutorial

Operating System Tutorial
DBMS and SQL Tutorial

Java Tutorial

C Language Tutorial

PHP Tutorial

Android Tutorial

Linux Guide Tutorial
Data Structures and Algorithms Tutorial

Computer Architecture

HTML 5 References Tutorial

Docker Tutorial

GIT (Using Github) Tutorial

Go Language Tutorial

GIT Guide

CSS Tutorial
Advanced Data Structures

Spring Framework Tutorial

Spring Boot Tutorial

Kotlin Tutorial

Apache Cordova Tutorial

Python Tutorial
SASS-SCSS Tutorial

MongoDB Tutorial

Numpy Tutorial
PL-SQL Tutorial

Python Built-in Functions Tutorial

Pandas Tutorial

Elasticsearch Tutorial

Matplotlib Tutorial

Web Scraping Tutorial

Networking with Python

Tkinter Tutorial

Java Programs Tutorial
Java Examples Tutorial

Servlet Tutorial

JSP Tutorial

Java Type Conversion Tutorial

Java 8 Tutorial

Java 9 Tutorial
Java 10 Tutorial

Java 11 Tutorial
Java Util Library Tutorial
Building a Contact Us Form in ReactJS
Building a Age Calculator App Using ReactJS
Movie Recommendation System Project Using Content-Based Filtering
Recipe Finder App using ReactJS
Sales Data Analysis Project for Beginners Using Data Science
Student Performance Analysis Project for Beginners Using Data Science

Word Counter Tool Using ReactJS

Customer Churn Prediction Project Using Classification Techniques
Basic Expense Tracker App using ReactJS

Simple Binary to Decimal Converter in React

Real-Time Unit Converter in React
House Price Prediction Using Machine Learning (XGBoost)
Weather Data Analysis and Visualization Using Python

Expandable Accordion Component using React

OTP Verification Component using React
Cricket Data Analysis Using Python

Credit Card Fraud Detection for Beginners using Data Science

Deep learning Tutorial

Software Development Life Cycle Tutorial
Stock Price Prediction for Beginners using Data Science

Apache Kafka Tutorial

Angular Tutorial

Django Tutorial

Computer Programming Tutorial

Tensorflow Tutorial

Java OOPs Concepts Tutorial
Building an Image Classification System Using CNN

News Recommendation System Using Machine Learning

Fake Review Detection System using Machine Learning
Product Feedback App Using Full Stack Development - Customer Review and Rating System

Job Portal with Applicant Tracking System Using Full Stack Development

(FalCon Store) A Modern React-Based E-Commerce App UI with Admin Dashboard

Student Management System using Python (Beginner-Friendly Project Guide)
HTML Tutorial - From Basics to Implementation
Machine Learning Tutorial

ReactJS Tutorial

Hibernate Tutorial

Data Analysis with Python Handbook
Probability and Statistics for Data Science

Artificial Intelligence Tutorial
Power BI Tutorial
R for Data Science