


Artificial Intelligence and Machine Learning Articles
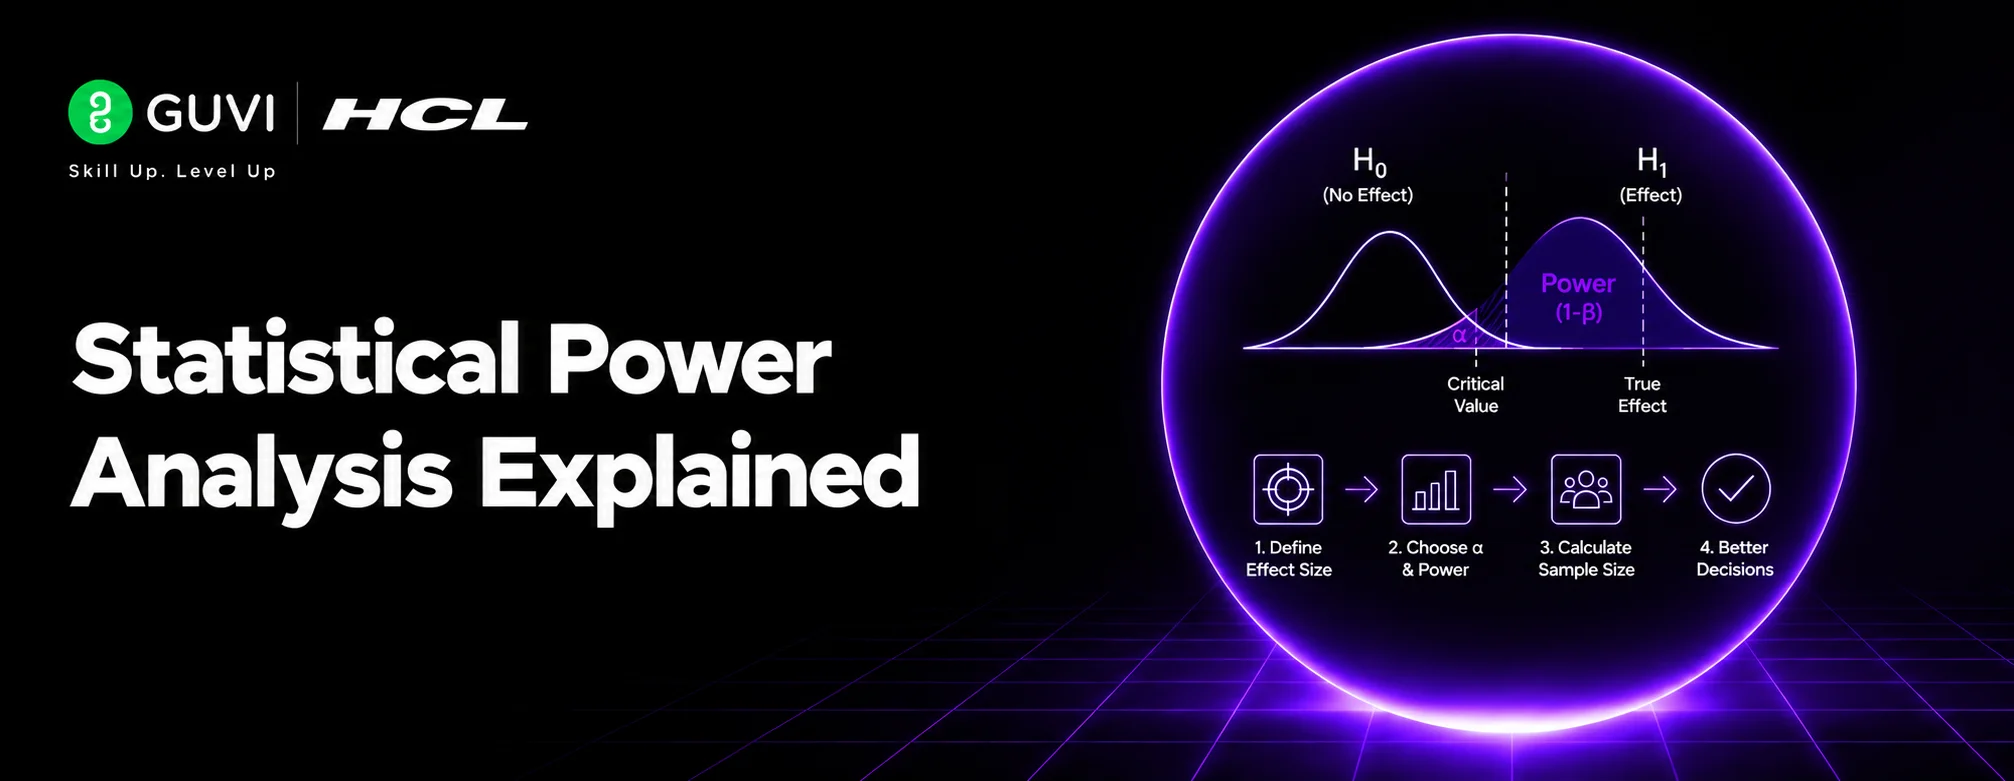
What is Statistical Power Analysis Explained
AI Model Compression Techniques: Pruning and Beyond


Get In Touch For Details! Request More Information

Understanding P-Values in Machine Learning
Sep 04, 2026 3 Min Read 10 Views
(Last Updated)
When analyzing machine learning experiments, data scientists often need to determine whether an observed difference is statistically meaningful or could have occurred by chance. P-values are used in statistical hypothesis testing to evaluate evidence against a null hypothesis. Understanding their meaning and limitations helps data scientists interpret experimental results more accurately.
Table of contents
- TL;DR Summary
- What Is a P-Value?
- How P-Values Work
- Step 1: Define the Question
- Step 2: Define the Hypotheses
- Step 3: Choose a Statistical Test
- Step 4: Calculate the Test Statistic
- Step 5: Calculate the P-Value
- Step 6: Interpret the Result
- P-Value and Significance Level
- Example in Machine Learning
- What a P-Value Does Not Tell You
- P-Values and Machine Learning
- Model Comparison
- Feature Analysis
- A/B Testing
- Experimental Research
- Key Concepts to Remember
- A Practical Workflow
- Define the Comparison
- Establish the Null Hypothesis
- Select the Test
- Set the Significance Level
- Calculate the P-Value
- Interpret the Evidence
- Examine Effect Size
- Consider Confidence Intervals
- Best Practices
- Real-World Applications
- Model Evaluation
- A/B Testing
- Feature Research
- Algorithm Experiments
- Conclusion
- FAQs
- What is a p-value?
- What does a small p-value mean?
- Is a p-value the probability that the null hypothesis is true?
- What does p < 0.05 mean?
- Does statistical significance mean practical importance?
- Can p-values be used to compare machine learning models?
- What should be considered alongside a p-value?
TL;DR Summary
- A p-value measures compatibility between observed data and a null hypothesis.
- A smaller p-value provides stronger evidence against the null hypothesis.
- Statistical significance does not necessarily mean practical importance.
- P-values should be interpreted alongside effect sizes and confidence intervals.
- A p-value does not represent the probability that the null hypothesis is true.
Direct Answer
| A p-value is a probability calculated under the assumptions of a statistical hypothesis test. It measures how unusual the observed result, or something more extreme, would be if the null hypothesis were true. In machine learning experiments, p-values can help assess whether observed differences between models, groups, or experimental conditions provide statistical evidence against a null hypothesis. |
What Is a P-Value?
Suppose a data scientist compares two machine learning models.
The hypotheses might be:
H₀: There is no difference in the models’ performance.
H₁: There is a difference in performance.
After performing an appropriate statistical test, the resulting p-value helps determine how compatible the observed difference is with H₀.
A smaller p-value indicates that the observed result would be less compatible with the null hypothesis under the test assumptions.
How P-Values Work
A typical hypothesis-testing process is:
Research Question → Hypotheses → Statistical Test → Test Statistic → P-Value → Interpretation
Step 1: Define the Question
Determine what difference or relationship you want to investigate.
Step 2: Define the Hypotheses
Specify the null and alternative hypotheses.
Step 3: Choose a Statistical Test
Select a test appropriate for the data and experimental design.
Step 4: Calculate the Test Statistic
Use the collected data to calculate the statistic required by the test.
Step 5: Calculate the P-Value
Determine how compatible the observed result is with the null hypothesis.
Step 6: Interpret the Result
Compare the p-value with the predefined significance level.
P-Value and Significance Level
A common significance level is:
α = 0.05
If:
p < 0.05
the result is often described as statistically significant under that testing framework.
If:
p ≥ 0.05
the result is generally described as not statistically significant.
However, this does not mean that p ≥ 0.05 proves the null hypothesis is true.
Example in Machine Learning
Imagine two classification models are evaluated on experimental data.
- Model A accuracy: 91%
- Model B accuracy: 89%
The observed difference is 2 percentage points.
A suitable statistical test produces:
p = 0.03
If the predefined significance level is 0.05, the result provides evidence against the null hypothesis under the assumptions of that test.
However, the data scientist should still consider whether a 2-percentage-point improvement is practically meaningful.
What a P-Value Does Not Tell You
A p-value does not tell you:
- The probability that the null hypothesis is true.
- The probability that the result occurred purely by chance.
- How large the observed effect is.
- Whether the result is practically important.
- Whether the model is better in every situation.
These interpretations are common mistakes.
P-Values and Machine Learning
P-values can appear in areas such as:
Model Comparison
Assess whether differences between experimental results provide statistical evidence of a difference.
Feature Analysis
In some statistical modeling approaches, hypothesis tests can be used to evaluate relationships between predictors and outcomes.
A/B Testing
Determine whether observed differences between experimental groups provide evidence against a null hypothesis.
Experimental Research
Evaluate statistical evidence when comparing algorithms or experimental conditions.
With sufficiently large datasets, very small effects can produce statistically significant p-values. This is why statistical significance and practical significance should be considered separately.
Key Concepts to Remember
- P-value: Measures compatibility of observed data with a null hypothesis under specified test assumptions.
- Null hypothesis: The default statistical claim being tested.
- Alternative hypothesis: The competing claim.
- Significance level: Predefined threshold used for statistical decisions.
- Statistical significance: Indicates evidence against the null hypothesis under the chosen framework.
- Effect size: Describes the magnitude of an observed effect.

A Practical Workflow
1. Define the Comparison
Clearly identify the models, groups, or conditions being compared.
2. Establish the Null Hypothesis
State what would be assumed if there were no meaningful difference or relationship.
3. Select the Test
Choose a statistical test based on the data and experimental design.
4. Set the Significance Level
Choose the threshold before interpreting the results.
5. Calculate the P-Value
Run the statistical test on the collected observations.
6. Interpret the Evidence
Compare the p-value with the predefined threshold.
7. Examine Effect Size
Determine whether the observed difference is large enough to matter in practice.
8. Consider Confidence Intervals
Use confidence intervals where appropriate to understand the uncertainty around the estimated effect.
Professionals interested in artificial intelligence, machine learning, and data science can strengthen their expertise through HCL GUVI’s Artificial Intelligence and Machine Learning Course.
Best Practices
- Define hypotheses before examining results.
- Select statistical tests based on the experimental design.
- Set the significance level in advance.
- Do not interpret p-values as probabilities that hypotheses are true.
- Report effect sizes alongside p-values.
- Consider confidence intervals.
- Avoid performing many tests without accounting for multiple comparisons.
- Distinguish statistical significance from practical significance.
The HCL GUVI’s Artificial Intelligence eBook introduces artificial intelligence, machine learning, generative AI, and intelligent automation concepts, helping learners build a broader understanding of modern AI technologies.
Real-World Applications
Model Evaluation
Compare machine learning models using appropriately designed statistical analyses.
A/B Testing
Evaluate whether changes to an application or product produce measurable differences.
Feature Research
Investigate statistical relationships between variables in suitable modeling frameworks.
Algorithm Experiments
Assess whether observed performance differences across experimental conditions provide statistical evidence of a difference.
Conclusion
P-values in Machine Learning can help evaluate statistical evidence when comparing models, analyzing experiments, or testing relationships. However, a p-value should never be treated as a standalone measure of model quality or importance. Proper interpretation requires attention to the null hypothesis, test assumptions, effect size, confidence intervals, experimental design, and practical significance.
FAQs
1. What is a p-value?
A p-value measures how compatible an observed result is with a null hypothesis under the assumptions of the statistical test.
2. What does a small p-value mean?
A small p-value indicates that the observed result would be relatively unusual under the null hypothesis, providing evidence against it.
3. Is a p-value the probability that the null hypothesis is true?
No. A p-value is not the probability that the null hypothesis is true.
4. What does p < 0.05 mean?
It means the p-value is below a commonly used significance threshold of 0.05. Under the test’s assumptions, this is often treated as evidence against the null hypothesis.
5. Does statistical significance mean practical importance?
No. A result can be statistically significant while having a very small practical effect.
6. Can p-values be used to compare machine learning models?
They can be used in appropriate statistical analyses of model comparisons, but the test must match the experimental design and observations being analyzed.
7. What should be considered alongside a p-value?
Consider effect size, confidence intervals, sample size, experimental design, test assumptions, and practical significance alongside the p-value.
Success Stories

About the Author
HCL GUVI
This article was selected and published as part of the HCL GUVI AI Blogathon 2026, an initiative designed to encourage students, AI enthusiasts, and aspiring tech writers to simplify complex AI concepts through impactful technical content. The contest recognized high-quality, original, and insightful AI-focused blogs, with selected authors receiving publication opportunities on the HCL GUVI blog platform along with official author credits and recognition.
View all posts by HCL GUVI
Connect with me @











Did you enjoy this article?