


Artificial Intelligence and Machine Learning Articles
Data Analyst vs Machine Learning Engineer: Which Career Grows Faster?
Finance Manager to Data Analytics: Career Growth, Salary and Seniority
How to Evaluate LLM Outputs in Production Deployments
AI/ML Skills Gap 2026: Why Companies Can't Find Job-Ready Talent


Get In Touch For Details! Request More Information

Confidence Intervals Explained for Data Scientists
Aug 27, 2026 4 Min Read 238 Views
(Last Updated)
Data scientists frequently work with samples rather than complete populations. A sample can provide useful estimates, but it also introduces uncertainty. Confidence Intervals help quantify that uncertainty by providing a range of plausible values for a population parameter.
Instead of reporting only a single estimate, such as an average conversion rate or mean income, a confidence interval shows how precise that estimate is likely to be based on the available sample data.
Table of contents
- TL;DR
- What Are Confidence Intervals?
- Why Do Data Scientists Use Confidence Intervals?
- How Are Confidence Intervals Calculated?
- What Does a 95% Confidence Interval Mean?
- Confidence Level vs Confidence Interval
- How Does Sample Size Affect Confidence Intervals?
- Confidence Intervals for Proportions
- Confidence Intervals in A/B Testing
- What Does a Wide Confidence Interval Mean?
- Confidence Intervals vs Prediction Intervals
- A Simple Data Science Example
- Key Takeaways
- Conclusion
- FAQs
- What are Confidence Intervals?
- What does a 95% Confidence Interval mean?
- Does a larger sample produce a narrower Confidence Interval?
- What is the difference between a Confidence Interval and a Prediction Interval?
- Why are Confidence Intervals important in data science?
TL;DR
- Confidence Intervals provide a range of plausible values for a population parameter.
- They communicate the uncertainty around a sample-based estimate.
- A confidence level, such as 90%, 95%, or 99%, determines the interval’s statistical procedure.
- Larger samples generally produce narrower intervals.
- A confidence interval should not be interpreted as the probability that a fixed population parameter lies inside the calculated interval.
What Are Confidence Intervals?
A Confidence Interval is a range calculated from sample data that is used to estimate an unknown population parameter.
For example, suppose a data scientist estimates that the average customer order value is ₹1,500.
Reporting only this number does not communicate how uncertain the estimate is.
A result such as:
Mean = ₹1,500, 95% CI = ₹1,420–₹1,580
provides additional information about the precision of the estimate.
The interval is calculated using a statistical method that incorporates the sample estimate and its variability.
Read More: Probability and Statistics for Data Science
Build strong AI and ML foundations with HCL GUVI’s Artificial Intelligence & Machine Learning Course. Learn statistics, machine learning, and real-world AI techniques through hands-on projects.
Why Do Data Scientists Use Confidence Intervals?
A point estimate alone can hide uncertainty.
Consider two experiments:
- Experiment A estimates a conversion rate of 12% with a narrow interval.
- Experiment B also estimates a conversion rate of 12% but has a much wider interval.
Although their point estimates are identical, the second result is less precise.
Confidence Intervals help data scientists evaluate:
- Estimate precision
- Sampling uncertainty
- Statistical significance
- Differences between groups
- Reliability of model and experiment results
A confidence interval is about the reliability of an estimation procedure, not a guarantee that every individual observation falls within the reported range.
How Are Confidence Intervals Calculated?
A simplified confidence interval can be represented as:
Estimate ± Margin of ErrorThe margin of error depends on factors such as:
- Standard error
- Sample size
- Confidence level
- Statistical distribution
For a mean under appropriate assumptions, a simplified form is:
Mean ± Critical Value × Standard ErrorAs sample size increases, the standard error generally decreases, which can result in a narrower interval.
What Does a 95% Confidence Interval Mean?
A 95% confidence level is commonly used in statistical analysis.
Suppose a study produces a 95% confidence interval of 45–55 for a population mean.
The correct frequentist interpretation is that if the same sampling procedure were repeated many times and a confidence interval were calculated each time, approximately 95% of those intervals would contain the true population parameter.
It is not technically correct to say there is a 95% probability that the fixed population parameter is inside this particular interval.
Pro Tip: When communicating results to non-statistical audiences, explain confidence intervals in terms of the reliability and uncertainty of the estimation procedure rather than describing them as a probability that the parameter is inside the specific interval.
Confidence Level vs Confidence Interval
These concepts are related but different.
Confidence level refers to the long-run coverage associated with the statistical procedure, such as 90%, 95%, or 99%.
Confidence interval is the actual range calculated from a particular sample.
For example:
95% confidence level → ₹950–₹1,050 confidence interval
Changing the confidence level generally changes the width of the interval.
How Does Sample Size Affect Confidence Intervals?
Sample size has a major effect on interval width.
With a small sample, estimates typically have greater uncertainty, resulting in wider intervals.
With a larger sample, estimates generally become more precise, producing narrower intervals when other factors remain similar.
For example:
| Sample Size | Estimated Mean | Confidence Interval |
| 50 | 100 | 88–112 |
| 200 | 100 | 94–106 |
| 1,000 | 100 | 98–102 |
These numbers are illustrative, but they demonstrate the general relationship between sample size and precision.
Best Practice: Do not increase sample size simply to obtain a narrower interval. Make sure the sampling method and data quality are also appropriate for the question being studied.
Confidence Intervals for Proportions
Confidence Intervals can also estimate population proportions.
For example, suppose an A/B test finds that 58% of users clicked a button.
Instead of reporting only:
Conversion rate = 58%
you could report:
Conversion rate = 58%, 95% CI = 54%–62%
This communicates both the estimated conversion rate and its uncertainty.
Proportion intervals can be calculated using several approaches, including methods based on the normal approximation, Wilson intervals, and exact methods.

The appropriate approach depends on sample size and the characteristics of the data.
Confidence Intervals in A/B Testing
A/B testing frequently uses confidence intervals to compare groups.
Suppose:
- Version A conversion rate = 10%
- Version B conversion rate = 12%
The difference is 2 percentage points.
A confidence interval around the difference can indicate how precisely that difference has been estimated.
If the interval around the difference includes zero, the data may not provide strong evidence of a difference at the corresponding confidence level.
Warning: A confidence interval should not be interpreted without considering the experimental design, sample size, multiple comparisons, and practical significance.
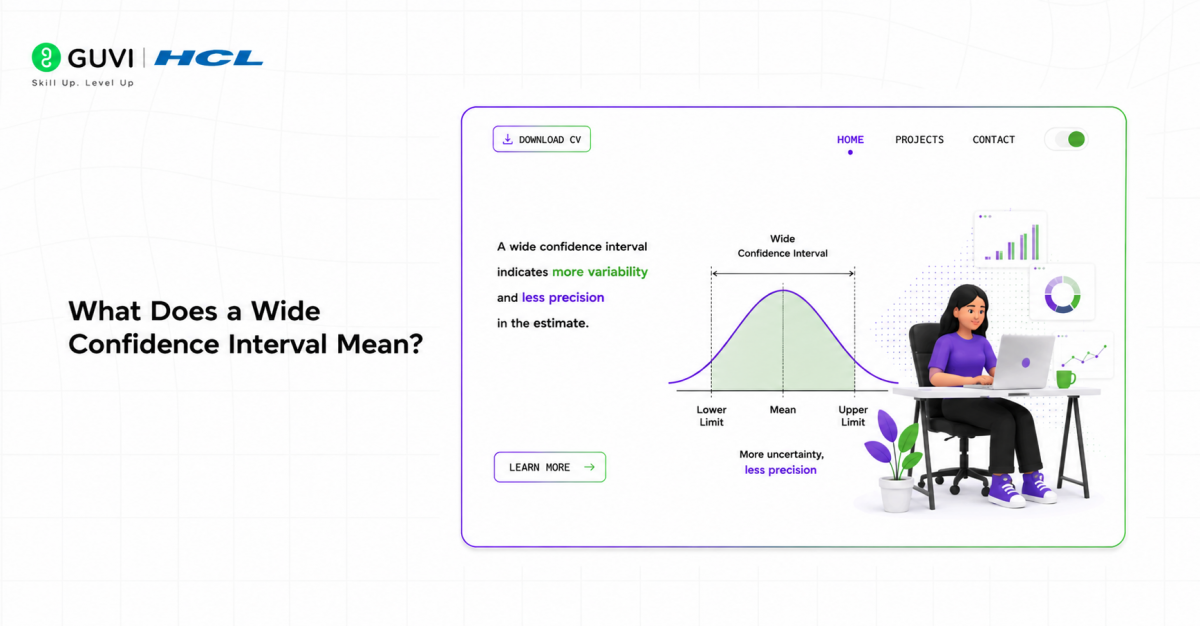
What Does a Wide Confidence Interval Mean?
A wide confidence interval indicates greater uncertainty or lower precision in the estimate.
This can happen because of:
- Small sample size
- High variability
- Rare events
- Noisy measurements
- An estimation method with high uncertainty
A narrow interval generally indicates greater precision, but it does not automatically mean that the estimate is accurate. Systematic bias can still produce a precise but incorrect result.
Confidence Intervals vs Prediction Intervals
These terms are sometimes confused.
A confidence interval generally estimates uncertainty around a population parameter or expected mean.
A prediction interval estimates a range in which a future individual observation is expected to fall.
Prediction intervals are usually wider because they account for both uncertainty in the estimated relationship and individual-level variation.
For example:
- Confidence interval → uncertainty around the average expected outcome.
- Prediction interval → uncertainty around a future individual outcome.
A Simple Data Science Example
Imagine a data scientist analyzes customer satisfaction scores from 500 randomly selected customers.
The sample mean is 82, and the calculated 95% confidence interval is 80–84.
The result can be reported as:
Average satisfaction score: 82 (95% CI: 80–84).
This tells stakeholders that 82 is the sample-based estimate while the interval communicates uncertainty around that estimate.
The interval should be interpreted according to the statistical procedure used to construct it.
Key Takeaways
- Confidence Intervals quantify uncertainty around sample-based estimates.
- They are commonly reported alongside point estimates.
- A 95% confidence level describes the long-run behavior of the interval-generating procedure.
- Larger samples generally produce narrower intervals.
- Wide intervals indicate lower precision.
- Narrow intervals do not eliminate sampling bias.
- Confidence intervals and prediction intervals answer different questions.
Build strong AI and ML foundations with HCL GUVI’s Artificial Intelligence & Machine Learning Course. Learn statistics, machine learning, and real-world AI techniques through hands-on projects.
Conclusion
Confidence Intervals are an essential statistical tool for data scientists because they add uncertainty information to point estimates. Whether you’re analyzing conversion rates, customer satisfaction, experiment results, or population means, reporting an interval can provide a more complete picture than a single number.
The most useful interpretation considers both the interval’s width and the quality of the underlying data. By combining confidence intervals with sound sampling, appropriate statistical methods, and practical significance, data scientists can communicate analytical results more accurately and responsibly.
FAQs
What are Confidence Intervals?
Confidence Intervals are ranges calculated from sample data to estimate an unknown population parameter while communicating uncertainty around the estimate.
What does a 95% Confidence Interval mean?
It means that, over repeated samples using the same procedure, approximately 95% of the resulting intervals would contain the true population parameter.
Does a larger sample produce a narrower Confidence Interval?
Generally, yes. Larger samples usually reduce standard error and therefore produce narrower intervals when other factors remain similar.
What is the difference between a Confidence Interval and a Prediction Interval?
A Confidence Interval typically describes uncertainty around a population parameter or expected mean, while a Prediction Interval estimates the range for a future individual observation.
Why are Confidence Intervals important in data science?
They help data scientists communicate the uncertainty and precision associated with estimates instead of relying only on a single point estimate.
Success Stories

About the Author
HCL GUVI
This article was selected and published as part of the HCL GUVI AI Blogathon 2026, an initiative designed to encourage students, AI enthusiasts, and aspiring tech writers to simplify complex AI concepts through impactful technical content. The contest recognized high-quality, original, and insightful AI-focused blogs, with selected authors receiving publication opportunities on the HCL GUVI blog platform along with official author credits and recognition.
View all posts by HCL GUVI
Connect with me @


















Did you enjoy this article?