


Software Development Articles
How to Read and Understand System Design Diagrams?
System Engineer Roles and Responsibilities: 12 Proven Duties for Growth
SAP Consultant Roles and Responsibilities: 12 Proven Duties for Growth and Success
Network Engineer Roles and Responsibilities: 12 Essential Duties for Success


Get In Touch For Details! Request More Information
Debugging in Software Development: Complete Guide with Tools and Techniques (2026)
Sep 05, 2026 9 Min Read 7393 Views
(Last Updated)
Debugging in software development is the process of finding, understanding, and fixing errors that prevent a program from working as intended. It’s not just about removing bugs — it’s about understanding why the code behaved unexpectedly in the first place.
Every developer, no matter how experienced, spends a significant chunk of their time debugging rather than writing new code. Knowing the right techniques and tools can turn hours of frustration into a quick, methodical fix — which is exactly what this guide walks you through.
Table of contents
- TL;DR Summary
- What is Debugging in Software Development?
- The Critical Role of Debugging in Software Development
- Common Types of Software Bugs
- The Workflow of Systematic Debugging
- Essential Debugging Techniques in Software Development
- The Scientific Process: Proposing a Hypothesis
- Print Debugging (or Logging)
- Using a Debugger
- Binary Search (The Divide and Conquer Strategy)
- Rubber Duck Debugging
- Static Code Analysis
- Code Review and Pair Programming
- Debugging Technique Comparison: When to Use, Tools, and Time Cost
- Debugging Tools for Python, JavaScript, and Java — Language-Specific
- AI-Powered Debugging Tools in 2026 — GitHub Copilot, Cursor, and More
- Debugging Best Practices for Sustainable Code
- Debugging in Agile Development
- Debugging Examples: Python Debugging with pdb — A Step-by-Step Walkthrough
- Common Debugging Mistakes Developers Make
- Conclusion
- FAQs
- What is the difference between debugging and testing?
- Can debugging help prevent software bugs from happening again?
- How long does it take to debug software?
- Is debugging for developers only?
TL;DR Summary
- Debugging in software development is the structured process of finding, understanding, and fixing errors — not just randomly changing code until it works.
- Core techniques include the scientific method, print debugging, using an interactive debugger, binary search, and rubber duck debugging.
- Tool choice is language-specific: pdb/debugpy for Python, Chrome DevTools/Node Inspector for JavaScript, and IntelliJ/Eclipse debuggers for Java.
- AI-powered tools like GitHub Copilot and Cursor now assist with debugging directly inside the editor, from spotting the bug to auto-fixing and opening a PR.
- Avoiding common mistakes — like skipping the error message or fixing symptoms instead of root causes — saves far more time than any single tool.
- NASA uses advanced debugging methods to ensure spacecraft code runs error-free during critical space missions.
- The world’s first computer bug — a moth found in 1947 — is preserved at the Smithsonian Museum in Washington, D.C.
- Research shows that nearly 90% of software project delays are caused by debugging and fixing unexpected errors.
- Google once revealed that a single memory leak bug in Chrome cost millions of dollars in lost ad revenue before it was fixed.
What is Debugging in Software Development?
What exactly is debugging in the context of software? It’s a multi-step process for identifying, investigating, and removing software errors (“bugs”) that create unexpected behavior, incorrect results, or crashes.
The origin story of the term “bug” is rather delightful. Computer pioneer Grace Hopper discovered the first “real” computer bug in 1947. She was checking on the relays of the Harvard Mark II computer when she found a moth that caused the computer to fail. She taped the moth into the logbook and said they were “debugging” the computer. And that’s how the term bug came to be used!
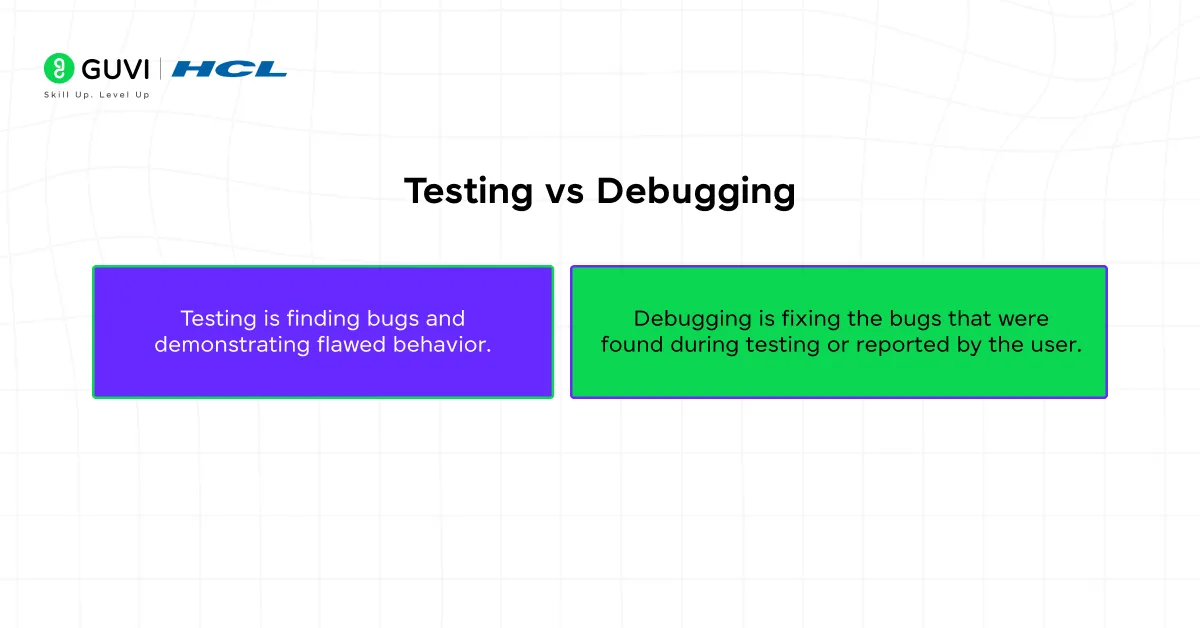
It’s important to distinguish between debugging and testing:
- Testing is finding bugs and demonstrating flawed behavior.
- Debugging is fixing the bugs that were found during testing or reported by the user.
Here’s the CTA based on the course page:
Ready to build the skills top tech companies hire for. The HCL GUVI’s Software and AI Engineer Course takes you from programming fundamentals to full stack, backend, and AI-powered development with hands-on projects, mentorship from industry professionals, mock interviews, and IITM-Pravartak certification. Enroll now and start your journey to becoming a job-ready software engineer.
The Critical Role of Debugging in Software Development
The importance of debugging in software development cannot be overstated. It is not a particular stage but an ongoing thread that is interwoven in the whole Software Development Life Cycle (SDLC).
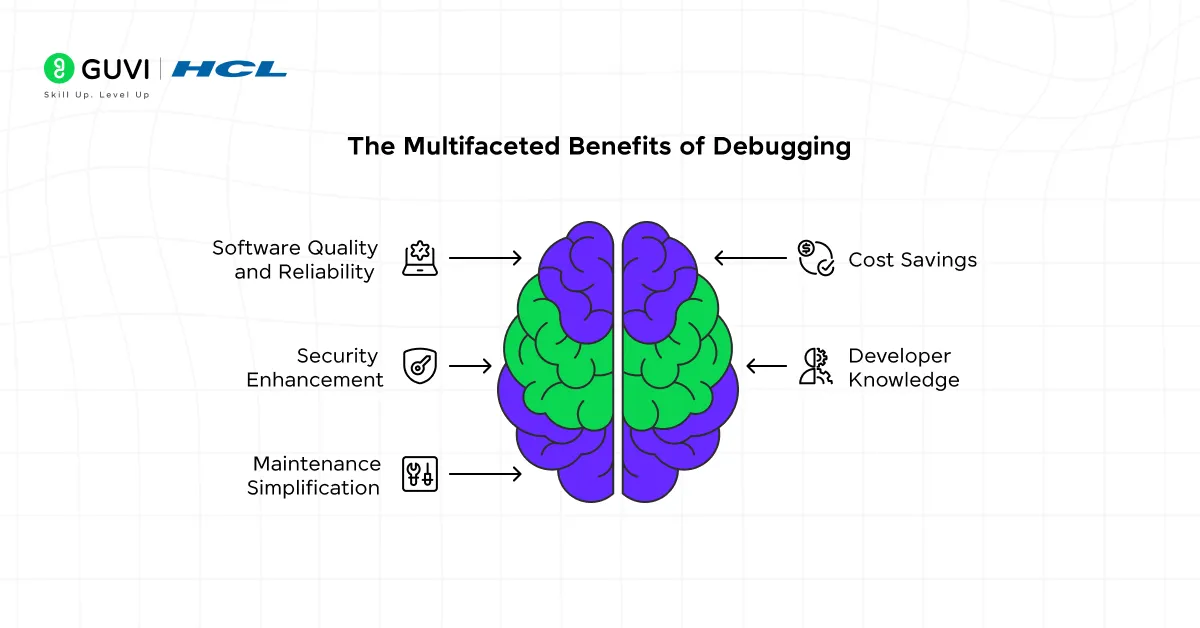
- Ensures Software Quality and Reliability: The most apparent role. Debugging directly impacts the stability and correctness of the final product, leading to higher user satisfaction and trust.
- Saves Time and Money: The earlier a bug is found and eliminated in the development cycle (e.g. during coding or unit testing), the more cost-effective the end product will be.
- Improves Security: Various security bugs, such as SQL injections or buffer overflows, are certain forms of software bugs. The primary defense against cyber threats is proactive debugging and code analysis.
- Increases Developer Knowledge: Debugging requires a developer to gain a deep insight into their own code as well as how it interacts with libraries, frameworks, and systems. It’s a powerful learning tool.
- Simpler Maintenance: Well-debugged code is cleaner, more predictable, and easier to maintain and extend in the future.
Common Types of Software Bugs
It is impossible to fix a bug if it is not recognized. And different kinds of bugs exist:
- Syntax Errors: The simplest to detect. The code does not comply with the programming language’s rules (incorrectly matched brackets, lack of semicolon). Modern IDEs usually do so right away.
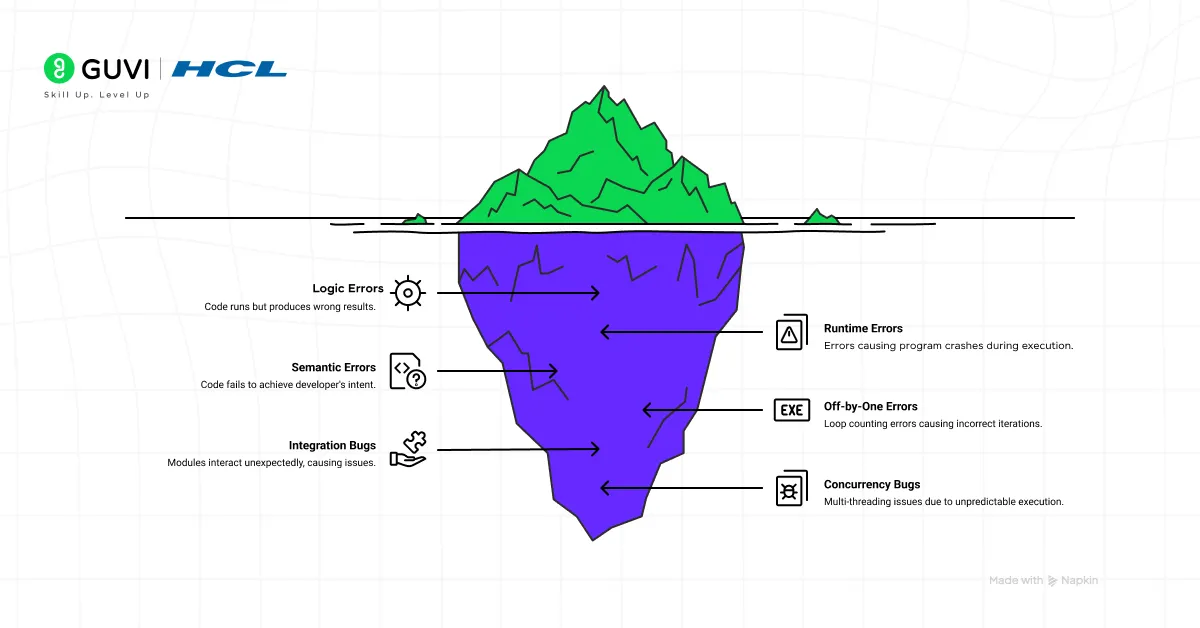
- Logic Errors: The code executes successfully, but gives the incorrect answer. They can be more difficult since the program believes that it is doing the right thing (e.g., the wrong formula, a bad conditional statement such as if (a > b) rather than if (a >= b).
- Runtime Errors: These are errors that happen as the program is running. They often cause a crash. Division by zero, attempting to open a file that does not exist, or memory exhaustion are some of the examples.
- Semantic Errors: These are logic errors in which the code is not syntactically incorrect but fails to accomplish the intended goal of the developer.
- Off-by-One Errors: An error in logic that is prevalent in loops where the loop counts incorrectly by either counting more times than it should count or counting fewer times than it should count (e.g. use <= instead of <).
- Integration Bugs: Occur when modules or services that are developed independently interact with each other in unintended ways (e.g., API version mismatch, wrong data format expectations).
- Concurrency (Race Condition) Bugs: These are bugs that are found in multi-threaded applications when the outcome depends on the unpredictable sequence of execution of threads. They are also infamously hard to reproduce and repair.
The Workflow of Systematic Debugging
The process of debugging a program cannot be done by mere guesses. It has a sequential, logical debugging process. This systematic practice is the initial move to mastery.
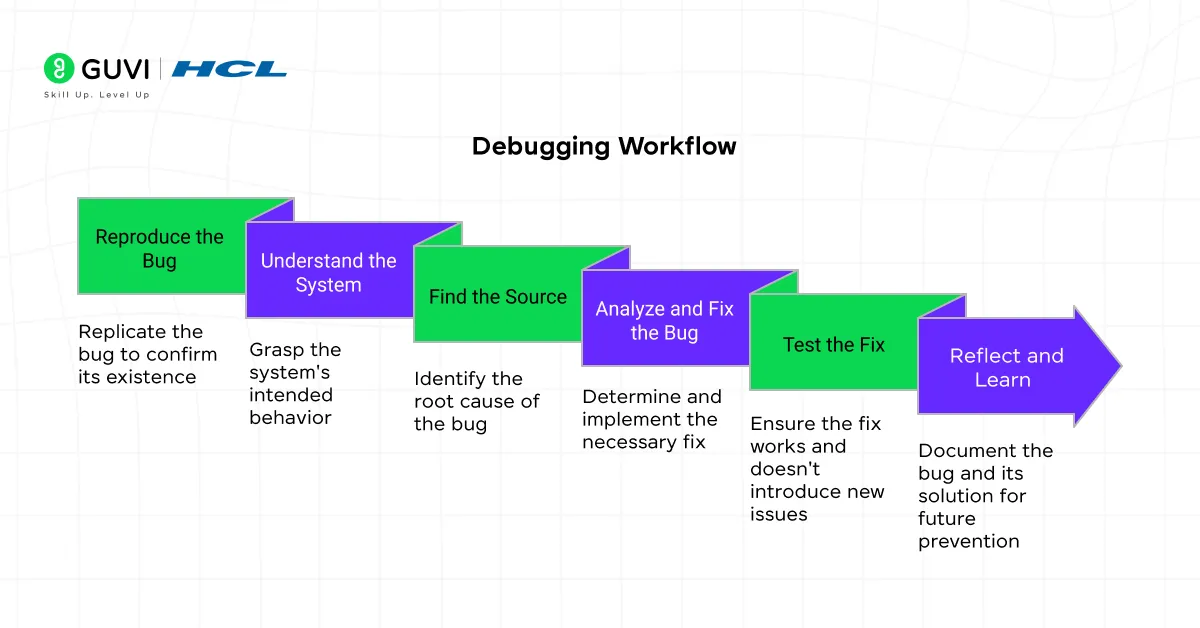
- Reproduce the Bug: The very first step. You cannot be sure you have fixed the problem unless you have been able to replicate the problem. Determine the precise procedures and input data, as well as the environmental factors that cause the bug.
- Understand the System: It is important to know what the code is meant to do. Make sure to check documentation, user stories, and requirements. A bug is a deviation from expected behavior..
- Find the Source (The Detective Work): This is the core of debugging. Identify the faulty logic that caused the problem with the help of debugging techniques and debugging tools discussed below.
- Analyze and Fix the Bug: Once the bug is found, examine the cause. Is it a mere typing mistake or a deeper structural defect? Devise a correction. The fix should be minimal and targeted to avoid introducing new bugs.
- Test the Fix: Make sure that your fix does not introduce a regression (it does not affect the functionality that already exists). Repeat the procedure to reproduce to ensure the bug is no longer there. Run the full test suite.
- Reflect and Learn: This is an ideal of best practice in debugging. Write down the bug and the remedy. Is it possible to avoid this kind of error in the future with a code review, a linter rule, or a unit test?
Essential Debugging Techniques in Software Development
A proficient debugger has access to a wide range of debugging methods. The following are the best:
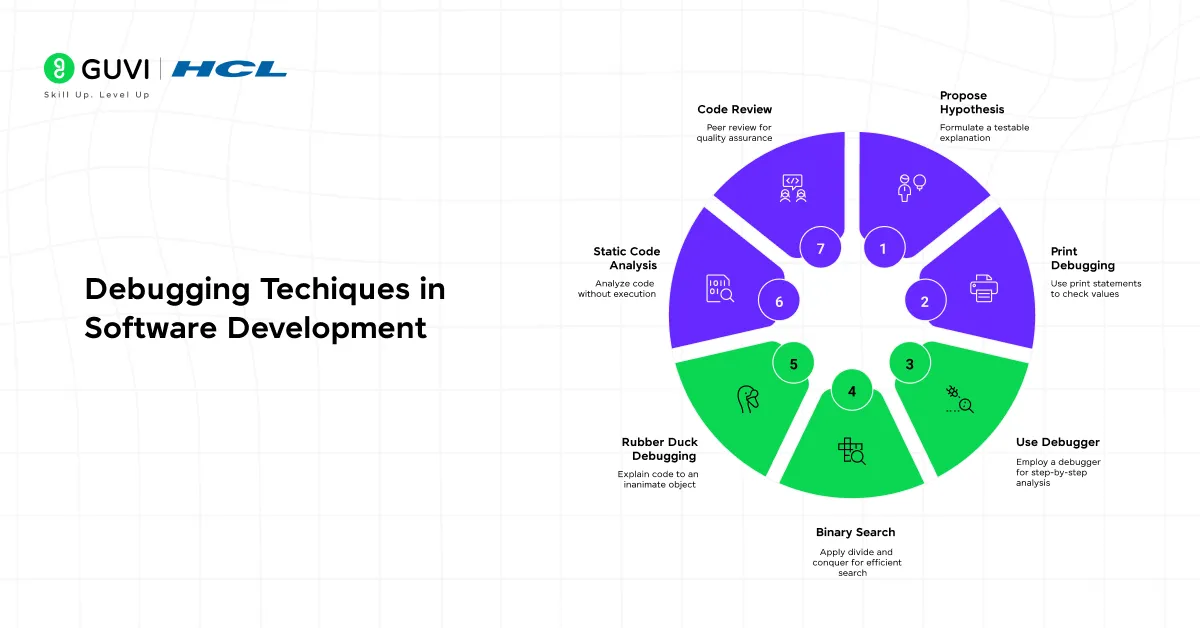
1. The Scientific Process: Proposing a Hypothesis
Approach debugging as an experiment. Using the evidence (error messages, logs, behavior) come up with a hypothesis about the possible causes of the bug. Then write a test (with a breakpoint, print statement, or log) to confirm or invalidate that hypothesis.
2. Print Debugging (or Logging)
The most effective but the simplest method. Placing and locating print statements (console.log, print, System.out.println) in strategic locations within the code to display the values of variables, flow of execution, and the value of functions returned. It is an easy method of seeing what is going on in your code at runtime.
3. Using a Debugger
A debugger with the ability to control program execution in fine-grained control mode. Modern debuggers (built into IDEs such as VS Code, IntelliJ, PyCharm, or Eclipse) can enable you to:
- Set Breakpoints: Stop on a given line of code.
- Step through Code: Debug the code line by line (Step Over), to the inside (step into) or the outside (step out) of functions.
- Inspect State: Examine the current value of all variables and the call stack when an object pauses.
This is the most effective method of knowing the state of run time in your program.
4. Binary Search (The Divide and Conquer Strategy)
To deal with large codebases, divide the problem space in half repeatedly until the bug is isolated. Comment out big chunks of code or find strategic breakpoints to identify which half the bug is in. Repeat this till you have narrowed down on the culprit.
5. Rubber Duck Debugging
One of the most interesting and popular debugging methods. Write out, line-by-line, to an inanimate object (such as a rubber duck), what you are coding and what the problem is. The process of stating the problem causes you to take your time and analyze your assumptions, which in most cases, causes you to arrive at the solution yourself.
6. Static Code Analysis
Running tools based on the source code (not running it) to identify possible bugs, code smells, and code violations (e.g., ESLint to analyze JavaScript, Pylint to analyze Python, SonarQube to analyze many languages).
7. Code Review and Pair Programming
One of the best debugging tools is having another pair of eyes. An error that you have grown blind to after too much time at the code can be frequently noticed by a colleague.
Debugging Technique Comparison: When to Use, Tools, and Time Cost
Please go through the table below to see how each technique compares in terms of usage, tools, and time investment:
| Debugging Technique | When to Use | Tools | Time Cost |
|---|---|---|---|
| Scientific Method (Hypothesis Testing) | Bug’s cause is unclear; need a structured approach before diving in | Notebook/scratchpad, breakpoints, print statements | Medium |
| Print Debugging (Logging) | Quick checks on variable values or execution flow; simple bugs | console.log, Python print/logging, System.out.println, Log4j | Low |
| Interactive Debugger | Need step-by-step control and full variable/state inspection | VS Code Debugger, IntelliJ IDEA Debugger, PyCharm Debugger, Eclipse Debugger, Chrome DevTools | Medium |
| Binary Search (Divide and Conquer) | Large codebase; bug location unknown; regression between two known states | git bisect, code commenting, strategic breakpoints | Medium |
| Rubber Duck Debugging | Stuck on a problem; need to re-examine assumptions | None (or a colleague, notebook, actual rubber duck) | Low |
| Static Code Analysis | Catching bugs and code smells before runtime; enforcing standards | ESLint, Pylint, SonarQube, Checkstyle | Low |
| Code Review / Pair Programming | Complex logic, subtle bugs, or knowledge silos | GitHub Pull Requests, GitLab Merge Requests, VS Code Live Share | Medium–High |
Debugging Tools for Python, JavaScript, and Java — Language-Specific
While the techniques above apply across languages, the actual tools you reach for depend heavily on the ecosystem you’re working in. Here’s a breakdown by language.
1. Python
- pdb — Python’s built-in interactive debugger. No installation needed; run a script with
python -m pdb script.pyor dropbreakpoint()directly into your code. - debugpy — The debugging engine behind VS Code’s Python extension. Also works standalone for remote debugging over SSH or in containers.
- PyCharm Debugger — A full graphical debugger built into PyCharm, with conditional breakpoints, variable watches, and an interactive console at each paused frame.
- ipdb — A drop-in enhancement over pdb with IPython-style autocomplete and syntax highlighting.
- py-spy — A sampling profiler that attaches to a running Python process without needing code changes, useful for production debugging.
2. JavaScript
- Chrome DevTools — The default choice for anything running in-browser. Set breakpoints, inspect the call stack, and watch network requests and DOM changes live.
- Node.js Inspector — Node’s built-in debugger, run with
node --inspect, which connects to Chrome DevTools or VS Code for server-side debugging. - VS Code JavaScript Debugger — Ships built into VS Code; supports breakpoints in both browser and Node contexts without extra configuration.
- console.log / console.table — Still the fastest way to check a value mid-execution, especially
console.tablefor inspecting arrays and objects.
3. Java
- IntelliJ IDEA Debugger — A mature graphical debugger with conditional breakpoints, expression evaluation, and hot code swapping while paused.
- Eclipse Debugger — Similar capabilities to IntelliJ’s, built into the Eclipse IDE, widely used in legacy enterprise codebases.
- jdb — The command-line Java debugger that ships with the JDK, useful when an IDE isn’t available.
- VisualVM — A profiling and monitoring tool for inspecting memory, threads, and CPU usage in a running JVM process.

AI-Powered Debugging Tools in 2026 — GitHub Copilot, Cursor, and More
Debugging used to mean digging through stack traces alone at 2 AM. That’s changed. AI tools now sit right inside your editor, read your error messages along with you, and often point at the actual line causing trouble before you’ve finished reading the traceback yourself.
Here’s what’s actually worth knowing about right now.
GitHub Copilot
Copilot has grown well beyond autocomplete. Its agent mode can pick up a failing CI build, work out why it’s failing, patch the code, and push the fix straight to a pull request — without you touching it.
You can also assign it a GitHub issue directly, and it’ll create a branch, write the fix, run the tests, and open a PR on its own.
For anyone whose day-to-day already lives inside GitHub pull requests and CI pipelines, this fits naturally into the workflow instead of feeling like a separate tool bolted on.
Cursor
Cursor takes a different approach — it’s a full AI-native editor rather than a plugin. Its Agent mode can open files, run terminal commands, and keep iterating on a bug until it’s actually fixed, not just until it looks fixed.
Composer handles multi-file edits with awareness of your whole codebase, so a fix in one file doesn’t quietly break something three files away.
There’s also BugBot, which reviews pull requests and flags issues before they ever get merged. One handy detail: Cursor lets you swap between different AI models depending on the task, so you’re not locked into just one “brain” behind the debugging.
Other tools worth having on your radar
- Amazon Q Developer — Strong if you’re already deep in AWS infrastructure; good at catching issues tied to cloud configs.
- Codeium — A solid free option that works across a wide range of languages and editors.
- Tabnine — Built for teams that need to keep code private, since it can run locally instead of sending code to the cloud.
- Replit AI — Browser-based and great for quick debugging on smaller projects or while learning.
Debugging Best Practices for Sustainable Code
It is by following best practices in debugging that you will become an effective developer and your code will become robust.
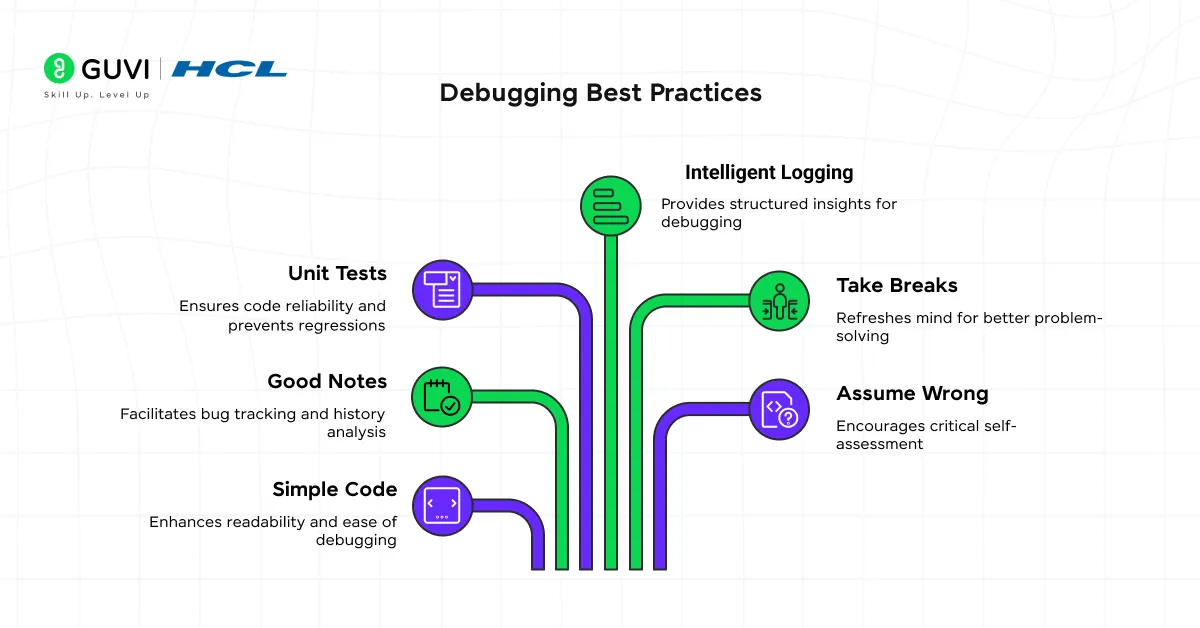
- Simple and Readable Code: Simple Code is simple to debug and well-structured, and simple to read. Do not use too smart and complicated one-liners. Use descriptive variable and function names.
- Take Good Notes: git bisect is a magical tool that searches your history of commit binarywise, automatically determining which commit introduced a bug.
- Adopt Unit Tests: A comprehensive test suite is your safety net. It allows you to do bugs, and, most importantly, makes sure your fix is not regressive. Test-Driven Development (TDD) inherently makes bugs minimized.
- Intelligent Logging: It is not necessary to debug with print, use a proper, structured logging early in life. Log at varying levels and ensure that your logs are meaningful.
- Take Breaks: Sometimes debugging is mentally tiring. When you’re stuck, walk away. You would find the solution when you come back with a new attitude.
- Assume You Are Wrong: Question yourself. The bug is where you believe to have your code right.
- Keep a Bug Book: Keep a record of difficult bugs and how to solve them. This will form a good body of knowledge to you and your team.
Debugging in Agile Development
In agile development, debugging is not an independent process, but it is one that happens within every sprint. The Agile concept of the early and continuous delivery of viable software requires early and continuous debugging.
- Shift-Left Debugging: The concept of moving debugging and testing activities earlier in the development process (to the “left” on a project timeline). . Developers write tests and debug their own code, as they write it.
- Continuous Integration (CI): Automated builds and tests run on every commit to code that instantly find integration and regression bugs, making them easier to track down and repair.
- Sprint Retrospectives: Teams discuss things that went badly, including what bug types keep coming up, and improve their process to prevent them in future (ex: “we should add a new linting rule to catch that”).
Debugging Examples: Python Debugging with pdb — A Step-by-Step Walkthrough
Let’s walk through a real example using Python’s built-in debugger, pdb, instead of just talking about it in theory.
The problem: A function meant to find the average of a list of numbers is throwing a ZeroDivisionError for certain inputs.
def calculate_average(numbers):
    total = 0
    for num in numbers:
        total += num
    average = total / len(numbers)
    return average

print(calculate_average([]))
Running this crashes with:
ZeroDivisionError: division by zero
Step 1: Drop a breakpoint into the code
Instead of guessing, pause execution right where the problem likely is:
import pdb

def calculate_average(numbers):
    total = 0
    for num in numbers:
        total += num
    pdb.set_trace()  # Execution will pause here
    average = total / len(numbers)
    return average

print(calculate_average([]))
Step 2: Run the script
python calculate_average.py
Execution stops right at pdb.set_trace(), and you land in an interactive (Pdb) prompt.
Step 3: Inspect the variables
From the prompt, check what’s actually in numbers and total:
(Pdb) p numbers
[]
(Pdb) p total
0
(Pdb) p len(numbers)
0
This confirms the hypothesis immediately — numbers is empty, so len(numbers) is 0, and the division on the next line is guaranteed to fail.
Step 4: Step through to confirm
Use n (next) to move to the next line and watch it fail live:
(Pdb) n
ZeroDivisionError: division by zero
Step 5: Fix the edge case
def calculate_average(numbers):
    if len(numbers) == 0:
        return 0
    total = 0
    for num in numbers:
        total += num
    average = total / len(numbers)
    return average
Step 6: Verify
print(calculate_average([]))          # 0
print(calculate_average([4, 8, 15]))  # 9.0
print(calculate_average([-5, 5]))     # 0.0
A few pdb commands worth remembering for next time:
| Command | What it does |
|---|---|
n | Next line |
s | Step into a function call |
c | Continue running until the next breakpoint |
p variable_name | Print a variable’s value |
l | List the surrounding code |
q | Quit the debugger |
Common Debugging Mistakes Developers Make
Even experienced developers fall into the same traps when they’re deep in a bug. These are the following:
- Changing code without a hypothesis: Randomly tweaking lines and rerunning to see what happens might get lucky once, but it usually just adds new bugs on top of the old one. Figure out why it’s broken before you touch anything.
- Ignoring the error message: The stack trace is often telling you exactly what’s wrong, but it’s easy to skim past it and jump straight to guessing. Read it slowly, line by line, before assuming anything.
- Not reproducing the bug reliably: If you can’t make the bug happen on demand, you can’t be sure you’ve actually fixed it. Chasing a bug that “sometimes happens” without pinning down the trigger wastes hours.
- Fixing the symptom, not the cause: Patching the one spot where the crash shows up feels like progress, but if the real issue is upstream, it’ll just resurface somewhere else later.
- Debugging alone for too long: Staring at the same fifty lines for two hours rarely helps. A second pair of eyes — or even just explaining the problem out loud — often gets you unstuck faster than powering through solo.
Conclusion
In software development, debugging involves more than just fixing bugs. It is a vital skill set that includes analytical thinking, deep technical knowledge, and perseverance. It is also the practice of turning confusion into clarity and disorder into order.
When you understand what debugging is, are comfortable with a variety of debugging techniques and methods, use debugging tools effectively, and follow by debugging best practices, you elevate your level in debugging. You no longer fear bugs: Rather, you learn to look at them and recognize them for what they are: puzzles to solve, a learning opportunity, and the last and perhaps most important step in the process of creating truly great software.
FAQs
1. What is the difference between debugging and testing?
Testing is focused on finding bugs by executing the program, while debugging is repairing the bugs after they have been discovered.
2. Can debugging help prevent software bugs from happening again?
Yes. Debugging will repair existing bugs, but in the process of debugging a program, it can uncover weaknesses in the code, which can help developers write more robust and cleaner code next time, resulting in fewer bugs.
3. How long does it take to debug software?
It depends on the complexity of the bug; some bugs can be repaired in just a few minutes. However, some bugs, like performance bugs or security bugs may take days or weeks to repair.
4. Is debugging for developers only?
Mostly, yes. However, testers, QA engineers, and DevOps teams also use debugging tools to help them find and analyze problems.
Success Stories














Did you enjoy this article?