


Data Science Articles
Accountant to Data Analyst: Skills, Roadmap and Career Path (2026)
SQL for customer support executives: What to Learn and How to Practice
Accounting Team Lead to Data Analytics Skills and Roadmap
Can an Insurance Professional Become a Data Analyst Early in Their Career?


Get In Touch For Details! Request More Information
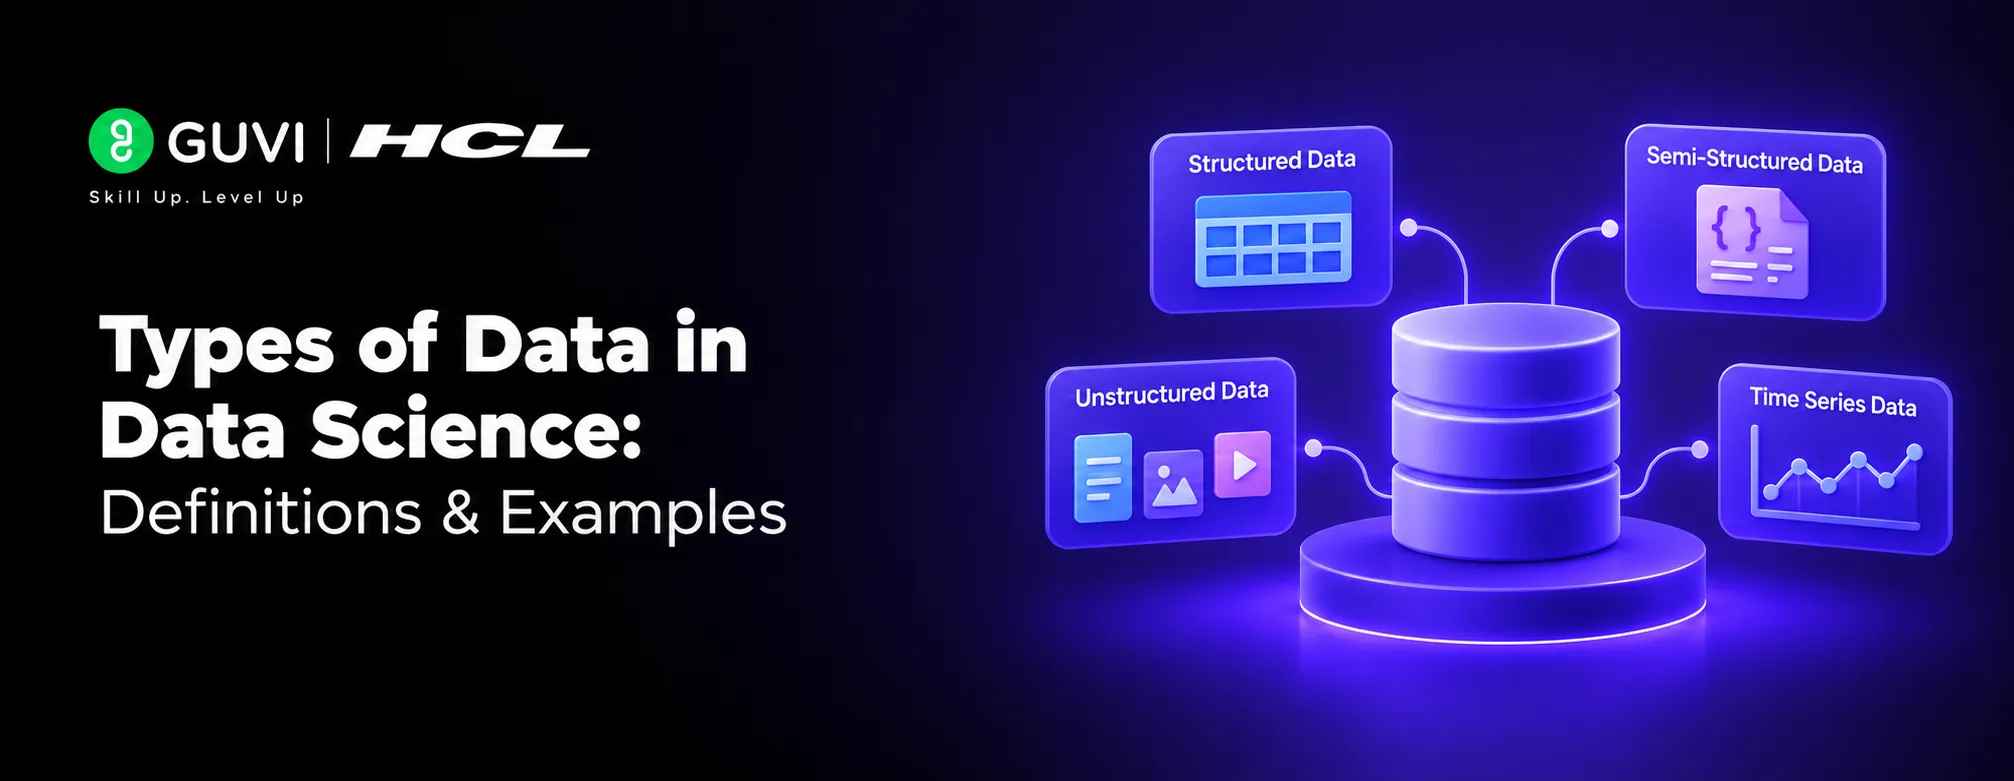
Types of Data in Data Science: Definitions, Examples, and Applications
Nov 04, 2026 4 Min Read 79500 Views
(Last Updated)
Understanding the types of data in data science is essential for analyzing information, choosing suitable statistical methods, and building effective machine learning models. Different datasets contain categories, rankings, counts, and measurements, and each requires an appropriate approach to processing and analysis.
For example, a customer’s location is categorical data, the number of purchases is countable data, and the time taken to complete an order is measurable data. Recognizing these differences helps you clean datasets, select visualizations, and prepare data for analysis.
In this article, we’ll explore the four main statistical data types, their real-world applications, the difference between structured and unstructured data, and how data types influence machine learning tasks.
Table of contents
- TL;DR
- What Are the Main Types of Data in Data Science?
- What Is Qualitative Data?
- What Is Nominal Data?
- What Is Ordinal Data?
- Nominal vs. Ordinal Data
- What Is Quantitative Data?
- What Is Discrete Data?
- What Is Continuous Data?
- Discrete vs. Continuous Data
- Structured vs. Semi-Structured vs. Unstructured Data
- How Do Data Types Affect Machine Learning?
- What Are the Scales of Measurement?
- Best Practices for Handling Data Types
- Conclusion
- FAQs
- What are the main types of data in data science?
- What is the difference between nominal and ordinal data?
- What is the difference between discrete and continuous data?
- Which data type is most used in machine learning?
- Why is it important to understand data types?
- What is the difference between structured and unstructured data?
TL;DR
- Data in data science is commonly classified as qualitative or quantitative.
- Qualitative data includes nominal and ordinal data.
- Quantitative data includes discrete and continuous data.
- Structured, semi-structured, and unstructured data describe how information is organized.
- Identifying data types helps you choose suitable preprocessing methods, visualizations, and analytical techniques.
What Are the Main Types of Data in Data Science?
The four commonly discussed statistical data types are nominal, ordinal, discrete, and continuous.
| Category | Data Type | Definition | Example |
| Qualitative | Nominal | Categories without a natural order | City, blood type |
| Qualitative | Ordinal | Categories with a meaningful order | Satisfaction rating |
| Quantitative | Discrete | Countable values | Number of website clicks |
| Quantitative | Continuous | Measurable values within a range | Height, temperature |
Understanding these classifications helps you determine how data should be collected, transformed, visualized, and analyzed.
1. What Is Qualitative Data?
Qualitative data, also called categorical data, describes characteristics, labels, or groups rather than quantities. Examples include product categories, payment methods, customer preferences, and job titles.
Qualitative data is often summarized using frequency counts, percentages, and categorical charts. In machine learning, some algorithms require categorical features to be encoded into numerical representations before processing them.
What Is Nominal Data?
Nominal data consists of categories without any natural ranking. One category is not inherently greater or smaller than another.
Examples include:
- Payment method: UPI, cash, credit card
- Product category: electronics, clothing, furniture
- City: Chennai, Mumbai, Bengaluru
- Blood type: A, B, AB, O
Nominal data is useful for grouping observations and identifying patterns across categories. Bar charts and frequency tables are common ways to present it.
For machine learning, one-hot encoding is often appropriate because it represents categories without introducing an artificial ranking.
What Is Ordinal Data?
Ordinal data consists of categories with a meaningful order, but the differences between adjacent categories are not necessarily equal.
Examples include:
- Customer satisfaction: dissatisfied, neutral, satisfied
- Education level: high school, bachelor’s, master’s
- Service priority: low, medium, high
- Product ratings: one star to five stars
Ordinal data helps analysts understand rankings and ordered preferences. However, assigning numbers to these categories does not automatically mean that the differences between them are equal.
Nominal vs. Ordinal Data
| Feature | Nominal | Ordinal |
| Natural order | No | Yes |
| Example | Payment method | Satisfaction level |
| Common analysis | Frequency and mode | Ranking, median, and mode |
| ML preparation | Often one-hot encoding | Encoding that preserves order, when appropriate |
2. What Is Quantitative Data?
Quantitative data, also called numerical data, represents quantities that can be counted or measured. Examples include revenue, customer age, number of orders, and delivery time.
It supports mathematical calculations and statistical analysis, including averages, variation, correlation, and regression. The two main types are discrete and continuous data.
Not all data can be analyzed in the same way. Understanding whether data is structured, semi-structured, or unstructured helps data scientists choose the right tools and techniques for effective analysis.
What Is Discrete Data?
Discrete data contains distinct, countable values. These are often whole numbers because they represent the number of items or events.
Examples include:
- Number of students in a class
- Number of customer complaints
- Website clicks
- Orders received per day
- Defects identified during inspection
Discrete data is useful for analyzing counts, event frequency, and operational activity. Bar charts, frequency tables, and histograms can help reveal patterns, depending on the data and analytical objective.
Some count-based problems can be modeled using probability distributions such as the Poisson or binomial distribution, provided their assumptions fit the situation.
What Is Continuous Data?
Continuous data represents measurements that can take many possible values within a range, including decimal values. The precision depends on the measuring instrument and how the data is recorded.
Examples include:
- Height and weight
- Temperature
- Time taken to resolve a support ticket
- Distance traveled
- Product dimensions
Continuous data is commonly used in trend analysis, statistical testing, and regression tasks. Histograms, box plots, scatter plots, and line charts can help visualize its distribution or relationships with other variables.
Discrete vs. Continuous Data
| Feature | Discrete | Continuous |
| Meaning | Countable values | Measurable values |
| Example | Number of orders | Order processing time |
| Collection | Counting | Measuring |
| Common analysis | Counts and event frequency | Distributions and regression |
| Common charts | Bar chart, histogram | Histogram, box plot, scatter plot |
3. Structured vs. Semi-Structured vs. Unstructured Data
Data can also be classified by how it is organized. This classification is different from the four statistical types.
- Structured data: Organized into a defined format, such as rows and columns in a spreadsheet or relational database.
- Semi-structured data: Contains organizational markers such as tags or key-value pairs but does not follow a rigid table structure. JSON and XML are common examples.
- Unstructured data: Does not follow a predefined tabular structure. Images, audio, videos, and free-text documents are examples.
| Data Structure | Example | Common Use |
| Structured | SQL tables | Reporting and analysis |
| Semi-structured | JSON API responses | Application integration |
| Unstructured | Images and text documents | Computer vision and natural language processing |
This distinction helps data professionals choose suitable storage systems, processing tools, and analytical workflows.
<WritingBlock id=”58326″ variant=”document”>## 4. How Are Data Types Used in Real-World Applications?
Different industries combine multiple data types to answer business questions.
- Healthcare
Patient categories, pain ratings, hospital visit counts, and temperature readings can support clinical reporting and operational analysis. Appropriate handling is essential for meaningful results.

- E-commerce
Product categories, customer ratings, order counts, and purchase amounts help businesses analyze customer behavior, sales patterns, and product performance.
- Education
Student locations, grade levels, correct-answer counts, and assessment scores can help institutions understand academic performance and identify areas that need improvement.
- Social Media Analytics
Platform names, engagement categories, like counts, and time spent on a page help teams evaluate content performance and audience engagement.
5. How Do Data Types Affect Machine Learning?
Data types influence preprocessing, feature selection, and the choice of analytical approach.
- Nominal features: Often require encoding, such as one-hot encoding, when the chosen algorithm cannot directly process categories.
- Ordinal features: May use order-preserving encoding when the ranking is meaningful and appropriate for the model.
- Discrete numerical features: Can support classification or regression, depending on the prediction target and problem.
- Continuous numerical features: Commonly support regression when predicting numerical outcomes.
Numerical data may also need scaling or transformation, depending on the algorithm. Categorical data does not always require the same encoding method, so preprocessing should reflect the data’s meaning and the model being used.
For example, a house-price prediction model might combine floor area (continuous), bedroom count (discrete), neighborhood (nominal), and property condition (ordinal).
Which data type is most used in machine learning?
There is no single data type that dominates every machine learning application. Many models use a combination of numerical and categorical features, while text, images, audio, and other unstructured data are important in specialized applications.
6. What Are the Scales of Measurement?
The four commonly discussed scales of measurement are nominal, ordinal, interval, and ratio. These describe how values can be categorized and compared.
| Scale | Key Property | Example |
| Nominal | Categories without order | Blood type |
| Ordinal | Ordered categories | Satisfaction rating |
| Interval | Equal intervals, no true zero | Temperature in Celsius |
| Ratio | Equal intervals and a meaningful zero | Weight, distance |
These scales help determine which mathematical operations and statistical comparisons are meaningful. For example, Celsius temperature has equal intervals, but zero degrees does not mean the complete absence of temperature.
Best Practice: Never assume that a column containing numbers is automatically continuous data. A postal code or product ID may contain digits but represent categories rather than measurable quantities..
Best Practices for Handling Data Types
Before analyzing a dataset, follow these practices:
- Inspect your columns: Identify whether each variable represents a category, ranking, count, or measurement.
- Check data quality: Look for missing values, duplicates, inconsistent labels, and incorrect formats.
- Choose suitable visualizations: Use charts that reflect the data and the question being investigated.
- Prepare features carefully: Select encoding, scaling, or transformation methods based on the data and model.
- Validate your assumptions: Check whether your analytical methods are appropriate for the dataset.
- Document transformations: Record important data-cleaning and preprocessing decisions so the analysis can be reproduced.
If you want to strengthen your understanding of data before exploring its different types, HCL GUVI’s Certified Data Science Course can help you build practical skills in Python, data analysis, statistics, machine learning, and real-world data science applications.
Conclusion
Understanding the types of data in data science helps you make better decisions throughout the analytical process. Nominal and ordinal data describe categories, while discrete and continuous data represent counts and measurements. Structured, semi-structured, and unstructured data provide another way to understand how information is organized.
By identifying data types correctly, checking data quality, and selecting appropriate preprocessing and visualization methods, you can build more reliable analyses and machine learning workflows. These fundamentals provide a strong starting point for anyone learning data science.
FAQs
1. What are the main types of data in data science?
The four commonly discussed statistical types are nominal, ordinal, discrete, and continuous. They fall into qualitative and quantitative categories.
2. What is the difference between nominal and ordinal data?
Nominal data contains categories without a natural order, such as payment methods. Ordinal data contains ordered categories, such as low, medium, and high priority.
3. What is the difference between discrete and continuous data?
Discrete data represents countable values, such as the number of orders. Continuous data represents measurements, such as delivery time or distance.
4. Which data type is most used in machine learning?
No single type is most important for every model. Many machine learning applications combine numerical and categorical features, while others work primarily with text, images, or audio.
5. Why is it important to understand data types?
Correctly identifying data types helps you select suitable statistical methods, visualizations, preprocessing techniques, and machine learning approaches.
6. What is the difference between structured and unstructured data?
Structured data follows a defined organization, such as rows and columns. Unstructured data, such as images or free-text documents, does not follow a predefined tabular format.
Success Stories

About the Author
HCL GUVI
This article was selected and published as part of the HCL GUVI AI Blogathon 2026, an initiative designed to encourage students, AI enthusiasts, and aspiring tech writers to simplify complex AI concepts through impactful technical content. The contest recognized high-quality, original, and insightful AI-focused blogs, with selected authors receiving publication opportunities on the HCL GUVI blog platform along with official author credits and recognition.
View all posts by HCL GUVI
Connect with me @


Did you enjoy this article?
Comments













as am preparing for my research , this tips helped me to grasp something i hadn't before.thank as i see something in me from this simple and understable take away
Hello! This article has helped me a lot. I'm a slow learner but i've understood the contents in one read. thank you soo much and keep up the exemplary work you are doing. Unakaa mwalimu mzuri sana.
no coment
I really enjoyed reading this article as i am learning data analysis for the first time… Your article helped me clear my queries. Easy to understand.daily life examples makes it more practical to understand.