


Career Articles
Data Analyst or Data Scientist: Which Has Better Demand for Mid-Career BPO Professionals?
BPO Workforce Management Analyst to Data Analyst: What Skills Transfer?
CFA Charterholders: Are You Missing Out on Data Science Opportunities?


Get In Touch For Details! Request More Information
MIS Analyst to Data Scientist: Skills, Roadmap and Salary
Oct 22, 2026 6 Min Read 22 Views
(Last Updated)
Every morning you refresh the same reports. Sales by region, TAT by team, attrition by month. Leadership reads them, asks why a number moved, and you spend the afternoon digging through pivots for an answer that the data could have predicted a week earlier.
That shift from reporting the past to predicting the future is the MIS analyst to data scientist move. You already own the data and the business context. You add Python, statistics, and machine learning, so your reports start answering “what next” instead of only “what was”.
Because you already work with data every day, this guide skips the basics and focuses on the MIS analyst to data scientist gap. You will see how MIS skills map to data science, a step-by-step roadmap, the Python and SQL depth you need, projects built from MIS work, and realistic salary numbers for India.
Table of contents
- TL;DR Summary
- What is the MIS Analyst to Data Scientist Transition?
- MIS Analyst Career Growth: Where the Role Plateaus
- MIS Executive to Data Scientist: Is the Jump Realistic?
- MIS Analyst to Data Analyst: The Bridge Role
- Why the Bridge Works
- What Changes in the Bridge Role
- When to Skip It
- Data Scientist Skills You Need
- Python for Data Science: Start With Your MIS Reports
- SQL for Data Science: Go Beyond SELECT
- Machine Learning Career Transition: Your First Model
- Data Science Roadmap for MIS Professionals
- Months 1 to 3: SQL and Python Foundations
- Months 4 to 6: Statistics and Analysis
- Months 7 to 9: Machine Learning
- Months 10 to 12: Portfolio and Bridge Role
- Months 12 to 18: Data Scientist Role
- Data Scientist Salary in India
- Salary by Role
- Salary Range by Career Stage
- Data Science Projects for MIS Analysts
- 💡 Did You Know?
- Common MIS Analyst to Data Scientist Mistakes
- Conclusion
- FAQs
- Can an MIS analyst become a data scientist?
- How long does the MIS analyst to data scientist transition take?
- Should I become a data analyst before an MIS analyst to data scientist move?
- Is Excel useful in an MIS analyst to data scientist career?
- Which projects suit an MIS analyst to data scientist portfolio?
TL;DR Summary
- What it is: The MIS analyst to data scientist move takes you from building periodic reports to building predictive models on the same data.
- What transfers: Excel modelling, data cleaning, KPI design, SQL basics, and business stakeholder management.
- What to learn: Python with pandas, advanced SQL, statistics, and machine learning with scikit-learn.
- Smart route: Most professionals move through a data analyst role first, then into data science within 12 to 18 months.
- Salary reality: MIS analysts in India average about ₹4.7 LPA, while data scientists average about ₹11.1 LPA.
- Next step: Automate one recurring MIS report in Python as your first MIS analyst to data scientist project.
What is the MIS Analyst to Data Scientist Transition?
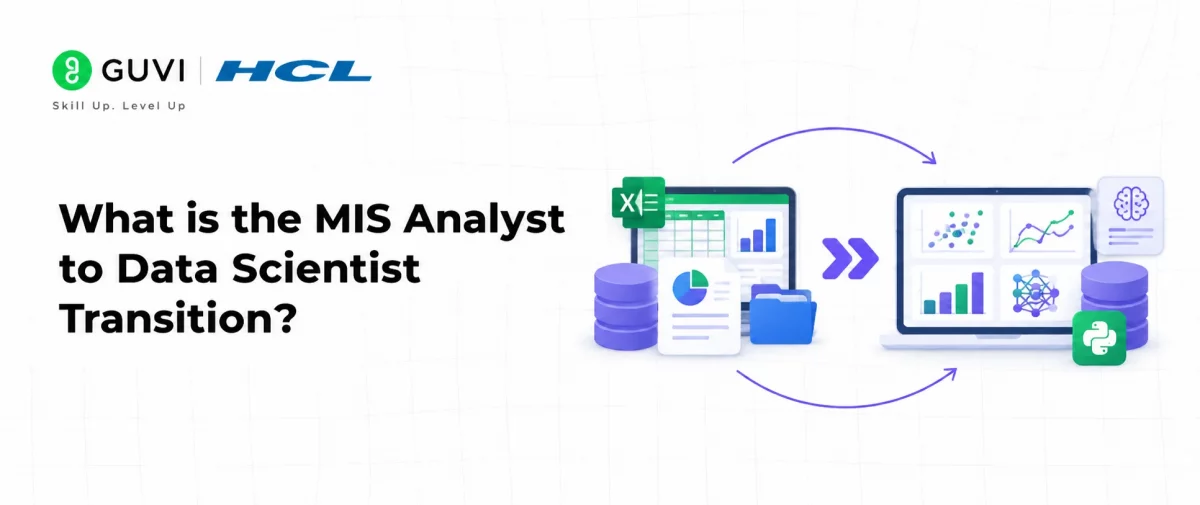
The MIS analyst to data scientist transition is a career move in which an MIS analyst or MIS executive shifts from producing descriptive reports to building statistical and machine learning models that predict outcomes and recommend actions.
An MIS analyst to data scientist switch is a natural progression rather than a restart. MIS work already covers the first half of the data science workflow: collecting, cleaning, and summarising data. The MIS analyst to data scientist shift adds the second half, which is modelling, experimentation, and prediction.
If you want a structured path with mentors and placement support, HCL GUVI’s Data Science Program, offered with IITM Pravartak, covers Python, SQL, statistics, machine learning, and deployment in weekday and weekend formats for working professionals.
MIS Analyst Career Growth: Where the Role Plateaus
MIS analyst career growth usually follows a predictable ladder: MIS executive, MIS analyst, senior MIS analyst, then MIS lead or MIS manager. The problem is that the work at each level looks similar. You build more reports, for more teams, with more automation in Excel.
That ceiling is the main reason professionals explore the MIS analyst to data scientist path. Data science roles sit closer to business decisions and pay significantly more at every level.
| Factor | MIS Analyst | Data Scientist |
|---|---|---|
| Core question | What happened? | What will happen and why? |
| Main tools | Excel, VBA, basic SQL | Python, SQL, scikit-learn |
| Output | Daily and monthly reports | Models, forecasts, experiments |
| Statistics depth | Averages, growth rates | Regression, hypothesis testing |
| Business impact | Visibility | Decisions and automation |
| Career ceiling | MIS manager | Lead data scientist, head of AI |
MIS Executive to Data Scientist: Is the Jump Realistic?
The MIS executive to data scientist jump is realistic, but rarely direct, and it takes longer than an MIS analyst to data scientist move. An MIS executive usually spends more time on data entry, report formatting, and Excel lookups than on analysis, so the technical gap is wider.
The practical route is a two-step move. First build analysis depth, then add machine learning. Executives who skip the analysis step often struggle in data science interviews because they cannot explain the statistics behind their models.
| Starting Role | Typical Gap | Realistic Timeline |
|---|---|---|
| MIS Executive | SQL, Python, statistics, ML | 15 to 24 months |
| MIS Analyst | Python, statistics, ML | 12 to 18 months |
| Senior MIS Analyst or Lead | ML and deployment | 9 to 12 months |
MIS Analyst to Data Analyst: The Bridge Role
For most people, MIS analyst to data analyst is the bridge that makes the MIS analyst to data scientist move possible. A data analyst role lets you work with SQL, Python, and dashboards full time while you build machine learning skills on the side.
1. Why the Bridge Works
Data analyst roles value your MIS background directly, which keeps the MIS analyst to data scientist path moving. Hiring managers see someone who already understands KPIs, data quality, and business users.
2. What Changes in the Bridge Role
You move from Excel-first to SQL-first work, from static reports to interactive dashboards, and from summarising data to explaining patterns in it. The shift mirrors moving from BPO to data analytics, where operations reporting also becomes the launchpad.
3. When to Skip It
If you already write SQL and Python at work, you can make the MIS analyst to data scientist jump directly through junior data scientist roles. Your portfolio then needs to carry the weight.
Data Scientist Skills You Need
Data scientist skills fall into four groups. The table shows where an MIS background puts you and what to prioritise for an MIS analyst to data scientist switch.
| Skill Area | What It Covers | MIS Starting Point | Priority |
|---|---|---|---|
| Programming | Python, pandas, NumPy | Excel and VBA | High |
| Data querying | Advanced SQL, joins, window functions | Basic SQL | High |
| Statistics | Probability, hypothesis testing, regression | Descriptive stats | High |
| Machine learning | Supervised and unsupervised models | None | High |
| Visualisation | Matplotlib, Seaborn, Power BI | Excel charts | Medium |
| Communication | Storytelling with data | Strong | Low |
Many MIS professionals worry about whether coding is required for data science. It is, but at a practical level you can build steadily from Excel formulas.
Python for Data Science: Start With Your MIS Reports
Python for data science is the biggest gap in the MIS analyst to data scientist journey, and the best way to learn it is by rebuilding work you already do. This example automates a monthly MIS summary that usually takes hours in Excel.
import pandas as pd

df = pd.read_csv("daily_transactions.csv", parse_dates=["txn_date"])
df["month"] = df["txn_date"].dt.to_period("M")

summary = (
    df.groupby(["month", "region"])
      .agg(revenue=("amount", "sum"),
           orders=("order_id", "nunique"),
           avg_order=("amount", "mean"))
      .reset_index()
)
summary["mom_growth_pct"] = (
    summary.groupby("region")["revenue"].pct_change() * 100
).round(1)

summary.to_excel("monthly_mis_summary.xlsx", index=False)
print(summary.tail())
Once you are comfortable with pandas, add NumPy for numerical work and Matplotlib or Seaborn for charts. Practise explaining your code, because Python interview questions appear in almost every data science hiring round.
SQL for Data Science: Go Beyond SELECT
SQL for data science goes deeper than the lookups most MIS roles need, and it is often the first technical test in MIS analyst to data scientist interviews. Data scientists use SQL to build features for models, which means CTEs and window functions. This query builds customer-level features for a churn model.
WITH customer_orders AS (
    SELECT customer_id,
           order_date,
           amount,
           LAG(order_date) OVER (
               PARTITION BY customer_id ORDER BY order_date
           ) AS prev_order_date
    FROM orders
)
SELECT customer_id,
       COUNT(*) AS total_orders,
       SUM(amount) AS total_spend,
       AVG(order_date - prev_order_date) AS avg_days_between_orders,
       MAX(order_date) AS last_order_date
FROM customer_orders
GROUP BY customer_id;
Practise by rewriting your daily MIS extracts as SQL queries with examples of joins, CTEs, and window functions you can reuse.
Machine Learning Career Transition: Your First Model
A machine learning career transition becomes real when you train a model on data you understand. Churn prediction is a strong first project for an MIS analyst to data scientist portfolio, because MIS teams already track customers and activity.

import pandas as pd
from sklearn.model_selection import train_test_split
from sklearn.ensemble import RandomForestClassifier
from sklearn.metrics import classification_report

df = pd.read_csv("customer_features.csv")
features = ["total_orders", "total_spend", "avg_days_between_orders",
            "days_since_last_order"]
X = df[features]
y = df["churned"]

X_train, X_test, y_train, y_test = train_test_split(
    X, y, test_size=0.2, random_state=42, stratify=y
)

model = RandomForestClassifier(n_estimators=200, random_state=42)
model.fit(X_train, y_train)

print(classification_report(y_test, model.predict(X_test)))
Focus on understanding precision, recall, and why the model makes each prediction. Knowing where the lines sit between AI vs ML vs data science also helps you target the right roles.
Data Science Roadmap for MIS Professionals
This data science roadmap assumes 8 to 10 hours of weekly study alongside your MIS job, the pace most MIS analyst to data scientist learners manage.
1. Months 1 to 3: SQL and Python Foundations
Move your daily reports from Excel to SQL and pandas, the first practical MIS analyst to data scientist milestone. Learn joins, CTEs, window functions, groupby, and merges.
2. Months 4 to 6: Statistics and Analysis
Learn distributions, hypothesis testing, correlation, and linear regression. Apply each one to an MIS dataset, such as testing whether a process change reduced TAT.
3. Months 7 to 9: Machine Learning
Cover regression, classification, clustering, and model evaluation with scikit-learn, the core of any MIS analyst to data scientist skill set. Build at least two models on business data.
4. Months 10 to 12: Portfolio and Bridge Role
Publish three to four projects and apply for data analyst or junior data scientist roles. Keep building models in your new role.
5. Months 12 to 18: Data Scientist Role
Use your on-the-job projects to apply for data scientist roles. This is where most MIS analyst to data scientist transitions complete.
Want to compress this roadmap with mentors and live projects? HCL GUVI’s Data Science Program follows the same sequence, from Python and SQL to machine learning, with placement support at the end.
Data Scientist Salary in India
Salary is the strongest pull in the MIS analyst to data scientist decision. The figures below are averages for India, and actual offers vary by city, company, and skill depth.
1. Salary by Role
| Role | Average Annual Salary |
|---|---|
| MIS Analyst | ₹4.7 LPA |
| Data Analyst | ₹6.5 LPA |
| Machine Learning Engineer | ₹8 LPA |
| Data Scientist | ₹11.1 LPA |
| Senior Data Scientist | ₹25.4 LPA |
2. Salary Range by Career Stage
| Role | Typical Experience | Annual Salary Range |
|---|---|---|
| MIS Executive | 1 to 8 years | ₹1.5 LPA to ₹4.8 LPA |
| MIS Analyst | 1 to 9 years | ₹2 LPA to ₹7 LPA |
| Senior Data Scientist | 3 to 11 years | ₹10 LPA to ₹48.6 LPA |
| Lead Data Scientist | 4 to 14 years | ₹12 LPA to ₹55.2 LPA |
The MIS analyst to data scientist salary jump is significant. An average data scientist earns more than double an average MIS analyst, and the starting point of a senior data scientist range sits above the ceiling of most MIS roles.
The top product-based companies for data scientists usually pay at the upper end of these bands. An MIS analyst to data scientist candidate with strong projects can target them within two to three years.
Data Science Projects for MIS Analysts
The best data science projects for MIS analysts use problems you already see at work. These projects prove the MIS analyst to data scientist shift better than any generic Kaggle dataset.
| Project | Technique | MIS Data It Uses |
|---|---|---|
| Customer churn prediction | Classification | Customer activity reports |
| Sales forecasting | Time series forecasting | Monthly sales MIS |
| TAT anomaly detection | Isolation Forest | Process and SLA reports |
| Customer segmentation | K-means clustering | Transaction summaries |
| Attrition prediction | Logistic regression | HR MIS reports |
| Report automation pipeline | Python and SQL | Any recurring MIS pack |
For an MIS analyst to data scientist portfolio, use anonymised or public datasets and document the business problem in each README. Pair the ML work with a few SQL project ideas to show query depth.
Present results the way you present MIS reports, then link every project from your data scientist resume and portfolio so recruiters see the business impact first.
💡 Did You Know?
- Most MIS reports already contain the target variables data scientists model, such as churn, attrition, and SLA breaches.
- pandas can read Excel files directly using
read_excel(), so your existing MIS workbooks can feed Python scripts without manual export. - scikit-learn’s
train_test_split()withstratifyhelps preserve class proportions in training and test sets, which matters for imbalanced data like churn.
Common MIS Analyst to Data Scientist Mistakes
- Jumping straight to deep learning: This is the most common MIS analyst to data scientist error. Classical ML solves most business problems.
- Skipping statistics: Interviews test why a model works, not just whether it runs.
- Staying in Excel too long: Move daily work into SQL and Python early so MIS analyst to data scientist practice happens on the job.
- Building generic projects: Titanic and Iris projects will not stand out. MIS-based business problems will.
- Undervaluing domain knowledge: Your understanding of KPIs and stakeholders is a real advantage. Lead with it.
Conclusion
The MIS analyst to data scientist move builds on what you already do: you own the data, know the business, and earn trust through reporting. Add Python, SQL depth, statistics, and machine learning, and your reports turn into predictions that drive decisions.
If you want mentorship and real projects along the way, explore HCL GUVI’s Data Science Program and start turning your MIS experience into a data science career.
FAQs
1. Can an MIS analyst become a data scientist?
Yes. The MIS analyst to data scientist path is common because MIS work already involves data collection, cleaning, and reporting. You need to add Python, statistics, and machine learning.
2. How long does the MIS analyst to data scientist transition take?
Most MIS analysts need 12 to 18 months of consistent learning, often with a data analyst role in between. MIS executives may need 15 to 24 months.
3. Should I become a data analyst before an MIS analyst to data scientist move?
For most MIS professionals, yes. A data analyst role builds SQL and Python depth on the job and makes the data scientist move easier.
4. Is Excel useful in an MIS analyst to data scientist career?
Excel helps with quick analysis and stakeholder reporting, but Python and SQL handle the core data science work. Treat Excel as a supporting tool.
5. Which projects suit an MIS analyst to data scientist portfolio?
Start with report automation in Python, then churn prediction and sales forecasting. They use data you already understand.
Success Stories

About the Author
Jebasta
I translate the language of data into stories that anyone can understand. As a writer with a data science background, I simplify analytics, AI, and decision-making so beginners and enthusiasts can confidently explore the world of data.
View all posts by Jebasta
Connect with me @










Did you enjoy this article?