
Data Analyst Career Roadmap – Skills, Projects, and Tools You Actually Need
Oct 10, 2025 7 Min Read 6184 Views
(Last Updated)
Every tap, search, or ride you book feeds into a growing ocean of data. Now picture being the one who doesn’t just observe that data, but transforms it into insights that drive billion-dollar decisions.
That’s the impact Data Analysts create. And it’s exactly why they’ve become one of the most in-demand, business-critical roles in today’s market.
India alone is on track to generate 11 million data-centric roles by 2026, claiming 32% of the global demand. This isn’t hype, it’s a shift in how the world works.
The good news? You don’t need a degree from a top-tier university or years of experience to get started. What you need is a clear roadmap.
And that’s exactly what this blog on Data Analyst Career Roadmap delivers – a step-by-step guide to go from absolute beginner to job-ready Data Analyst. You’ll learn what the role involves, which skills to master (and in what order), how to build real-world projects, and what it takes to land your first job.
Table of contents
- What Does a Data Analyst Do?
- Data Analyst vs Data Scientist vs Business Analyst: Quick Comparison
- Data Analyst Career Roadmap
- Month 0: Set Your Foundation
- Month 1: Learn Excel and Basic Statistics
- Month 2: SQL for Data Analysis
- Month 3: Data Visualization and Storytelling
- Month 4: Python for Data Analysis
- Month 5: Build Your Projects and GitHub Portfolio
- Month 6: Resume, LinkedIn, and Interview
- Final thoughts
- FAQs
- What is the roadmap for a data analyst?
- Can AI replace a data analyst?
- What is the career path for a data analyst?
- What is the salary of data analyst roadmap?
- Does a data analyst have a future?
What Does a Data Analyst Do?
Imagine a fast-growing EdTech startup planning its next quarter.
They’re not relying on gut instincts. They need solid answers to critical questions like:
- Why did user sign-ups drop in April?
- Which course modules are causing the most learner drop-offs
- Where should we launch our next marketing campaign?
- Which channels are burning budget without results?
Here’s the truth: these aren’t opinion-based calls.
Every decision depends on data but raw data alone doesn’t help.
That’s where a Data Analyst steps in. The core job of a data analyst is to bridge the gap between messy, scattered, and often incomplete data and clear, actionable insights. From cleaning and organizing chaotic datasets to identifying trends and translating them into business strategy, analysts turn noise into narrative.
You’re not just crunching numbers. You’re making data useful. You’re answering the questions that help businesses grow.
Data Analyst vs Data Scientist vs Business Analyst: Quick Comparison
Why this matters: In many companies, these roles work side by side, but they serve very different purposes. Before you map your career path, it’s important to know what you’re aiming for.
| Attribute | Data Analyst | Data Scientist | Business Analyst |
| Primary Focus | Analyze structured data to support decisions | Build predictive models using complex data | Identify business needs and suggest solutions |
| Key Skills | SQL, Excel, Data Visualization, Basic Python | Python, Machine Learning, Statistics, SQL | Communication, Process Mapping, Basic SQL |
| Tools Used | Excel, Power BI, Tableau, SQL | Python, TensorFlow, scikit-learn, Jupyter | Excel, PowerPoint, Jira, BPM tools |
| Typical Output | Dashboards, reports, trend analyses | Predictive models, machine learning algorithms | Business cases, process improvement plans |
| Use Case in an Organization | Turns raw data into actionable insights to guide day-to-day decisions | Develops advanced models to forecast trends and automate decisions | Bridges business goals and IT by translating requirements and improving processes |
Want to follow the Data Analyst roadmap with the right resources? HCL GUVI’s Free Resources Hub has everything you need – beginner-friendly courses, datasets, Python and SQL practice, and resume-building tools to help you kickstart your journey as a Data Analyst, completely free.
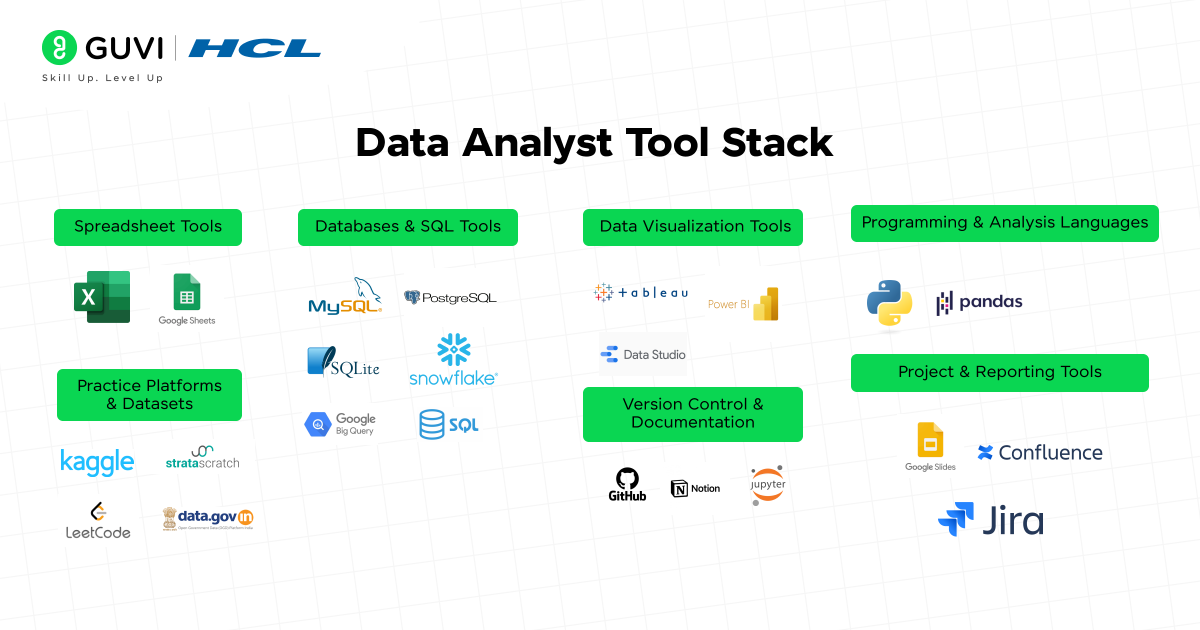
Data Analyst Career Roadmap
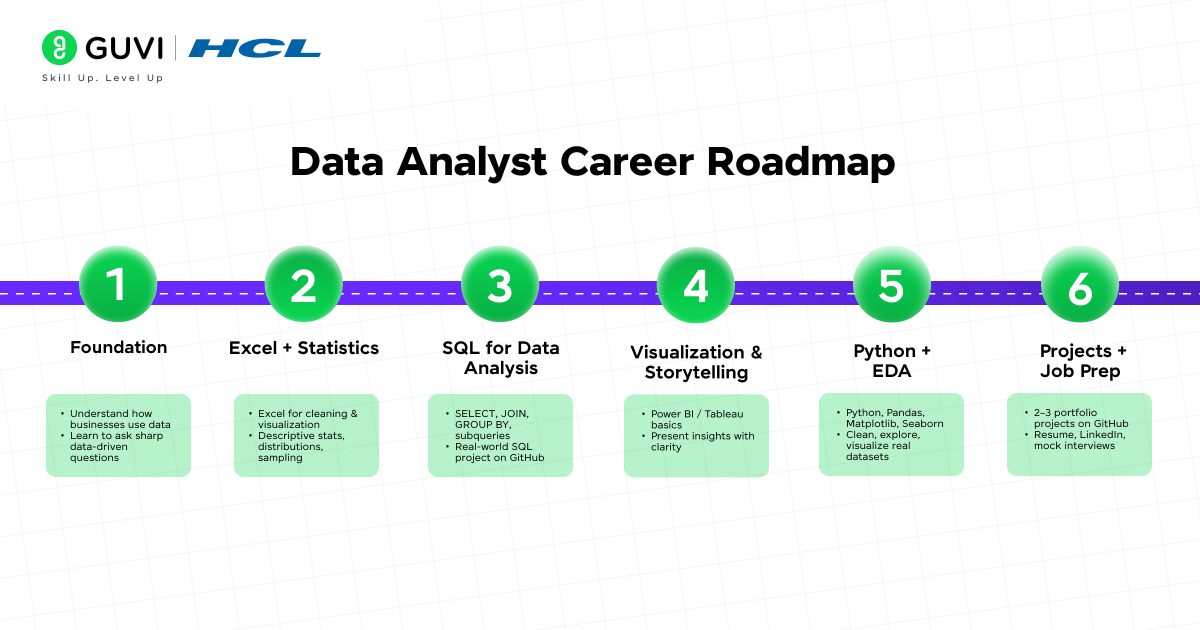
Month 0: Set Your Foundation
Before you open your first dataset or install any fancy tool, this month is all about thinking like a data analyst. Not just learning tools, but building a razor-sharp mindset to solve business problems with data, because that’s what companies pay you for.
It’s easy to drown in tutorials and content rabbit holes, but if you want to build a career that lasts, you start here — with the fundamentals that separate “I know the tools” from “I know how to drive decisions.”
Here’s your focus for Month 0 on your Data Analyst Career Roadmap:
1. Understand How Businesses Use Data
Why this matters:
Every chart you build, every SQL you write, must tie back to a real business need. Analysts don’t just clean data — they influence pricing, retention, inventory, marketing spend, and more.
Your next 3 steps:
- Scan job descriptions on platforms like LinkedIn or Naukri.com. Note the top tools and skills that keep coming up. You’ll start to see what’s expected in real-world jobs.
- Study real-world examples:
Think about how:- E-commerce platforms track buying patterns for personalized offers
- Banks use transaction data to detect fraud
- Hospitals use patient data to optimize care delivery
- Observe how businesses talk about data:
Look at company blogs or news articles and ask: What data decisions likely went behind this strategy?
2. Learn How to Ask the Right Questions of Data
Why this matters:
Tools change. But one skill never gets outdated: your ability to translate vague goals into sharp data questions. That’s what will make you stand out in interviews, whiteboard rounds, and even day one on the job.
For example:
“Improve customer retention” → “Which segments churn the most after their 2nd order?”
“Boost sales” → “Which products had rising cart abandonment in Tier 2 cities last quarter?”
Your next 3 steps:
- Practice this: Use the SMART framework to turn business goals into clear, measurable data questions. Do 1 example every day for a week.
- Reverse engineer this: Take startup headlines or LinkedIn posts, and ask: “If I were the analyst here, what question would I ask first?”
(E.g., Zomato expands to Tier 3 cities → “How does average order value differ between Tier 1 and Tier 3 cities?”)
- Join this: Lurk on Reddit’s r/datascience, and observe how analysts troubleshoot and break down problems. Or explore LinkedIn posts with business case challenges.
Month 1: Learn Excel and Basic Statistics
Goal: Master Excel for data manipulation and build a statistical foundation to interpret data accurately.
Why Excel is Still Essential
- Why It Matters: Excel remains a cornerstone for 80% of data analysts in India, especially in SMEs, BFSI, and retail, for quick data cleaning, reporting, and visualization. It’s a must-have for fresher roles (₹4-8 LPA) and is often tested in interviews.
- Action Steps:
- Master key formulas: SUM, AVERAGE, IF, COUNTIF, TEXT, and DATE functions.
- Learn pivot tables to summarize data (e.g., sales by region or product category).
- Practice VLOOKUP, HLOOKUP, and XLOOKUP for joining datasets.
- Create dynamic charts (bar, line, pie, combo) to visualize trends.
- Solve 20–30 real-world Excel problems (e.g., calculate monthly revenue growth or filter high-value customers).
Basics of Descriptive Statistics, Distributions, Sampling
- Why It Matters: Statistics enables analysts to summarize data (mean, median), understand variability (standard deviation), and validate findings. This is critical for roles involving A/B testing, forecasting, or customer segmentation.
- Action Steps:
- Learn descriptive statistics: mean, median, mode, range, variance, standard deviation.
- Understand distributions: normal, skewed, uniform, and their impact on analysis (e.g., skewed data may require median over mean).
- Study sampling techniques: random, stratified, and how to avoid bias (e.g., ensure samples represent diverse customer groups).
- Apply statistics in Excel: Use built-in functions like AVERAGE, STDEV, or create histograms to visualize distributions.
Month 2: SQL for Data Analysis
Goal: Master SQL to query databases and build a portfolio-worthy project.
Learn SELECT, JOIN, GROUP BY, and Subqueries
- Why It Matters: SQL is a non-negotiable skill for 70% of data analyst roles in India, used to extract and analyze data in companies like TCS, Amazon, and Flipkart. It’s heavily tested in technical interviews.
- Action Steps:
- Master core queries: SELECT, WHERE, ORDER BY, LIMIT/TOP.
- Learn JOINs (INNER, LEFT, RIGHT, FULL) to combine multiple tables (e.g., merge customer and order data).
- Use GROUP BY with aggregates (COUNT, SUM, AVG, MIN, MAX) for summarization (e.g., total sales by product).
- Practice advanced concepts: subqueries, CTEs, and window functions (e.g., RANK, ROW_NUMBER) for complex analysis.
- Solve 50–70 problems on platforms like HackerRank, StrataScratch, or LeetCode to build fluency.
Practice on Real Datasets
- Why It Matters: Working with real datasets simulates workplace tasks, building confidence and project-ready skills.
- Action Steps:
- Download datasets from Kaggle (e.g., “Retail Sales,” “Employee Attrition,” or “COVID-19 India”).
- Practice business-relevant queries: e.g., “Identify top 10 customers by spend” or “Calculate monthly churn rates.”
- Use free online SQL environments like DB Fiddle or Mode Analytics to run queries without local setup.
Build a Small SQL Project
- Why It Matters: Projects demonstrate practical expertise to recruiters, setting you apart in a competitive market.
- Action Steps:
- Select a dataset (e.g., Kaggle’s “Superstore Sales” or “E-commerce Transactions”).
- Write 8–12 queries to answer business questions (e.g., “Which regions have the highest return rates?” or “What are peak sales months?”).
- Create a GitHub repository with a README explaining the dataset, queries, and insights.
- Bonus: Visualize results using Excel or Google Sheets to show cross-tool proficiency.
- Example Project: Analyze retail sales to identify high-margin products and seasonal trends, with documented queries and a summary of findings.
Month 3: Data Visualization and Storytelling
Goal: Create professional dashboards and master data storytelling to communicate insights.
Learn Tableau or Power BI
- Why It Matters: Visualization tools are used by 60% of data analysts in India. They’re essential for presenting insights to non-technical stakeholders.
- Action Steps:
- Choose one tool: Tableau Public (free) or Power BI Desktop (free).
- Learn to connect datasets, create calculated fields (e.g., profit margin = revenue/cost), and build visuals (bar charts, line graphs, heatmaps).
- Add interactivity: filters (e.g., by region), parameters (e.g., date ranges), and drilldowns (e.g., category to product).
- Complete 5–7 guided projects (e.g., sales dashboards, customer segmentation) using free tutorials from tool websites.
Basics of Data Storytelling
- Why It Matters: Storytelling bridges data and decision-making, a skill tested in interviews and valued in client-facing roles (e.g., presenting insights to marketing teams).
- Action Steps:
- Adopt a storytelling framework: Context (business problem) → Problem (data question) → Analysis (findings) → Recommendation (action).
- Practice concise communication: e.g., “Sales dropped 15% due to low stock in Q3; recommend increasing inventory for high-demand items.”
- Analyze public dashboards on Tableau Public to learn how professionals structure narratives.
Build One End-to-End Dashboard Project
- Why It Matters: Dashboards showcase technical and communication skills, making your portfolio stand out.
- Action Steps:
- Choose a dataset (e.g., Kaggle’s “India E-commerce Sales” or “Healthcare Patient Data”).
- Build a dashboard with 4–6 visuals (e.g., revenue by category, customer demographics, trends over time).
- Add interactivity (filters, drilldowns) and a summary of key insights (e.g., “Tier 2 cities drive 40% of sales”).
- Publish on Tableau Public or save Power BI as a PDF; add to GitHub with a README explaining the business context and design choices.
- Example Project: Dashboard analyzing e-commerce sales with filters for region, product, and time, highlighting high-growth categories.
Month 4: Python for Data Analysis
Goal: Master Python for advanced data analysis and complete a portfolio-ready mini-project.
Python Basics, Pandas, NumPy, Matplotlib, Seaborn
- Why It Matters: Python is used by 65% of data analysts in India, especially in tech, AI, and e-commerce companies (₹8–15 LPA roles). It’s ideal for data cleaning, EDA, and visualization.
- Action Steps:
- Learn Python fundamentals: variables, loops, functions, lists, dictionaries, and modules.
- Master Pandas for data manipulation: filtering, grouping, merging, and handling missing data.
- Use NumPy for numerical tasks: arrays, matrix operations, and statistical calculations.
- Create visualizations with Matplotlib (line plots, scatter plots) and Seaborn (heatmaps, pair plots) for professional-grade graphics.
- Complete 30–40 coding exercises on platforms like Kaggle or Codecademy.
Data Cleaning, Transformation, Exploratory Data Analysis (EDA)
- Why It Matters: Data cleaning and EDA consume 50% of an analyst’s time, ensuring data quality and uncovering actionable patterns.
- Action Steps:
- Learn to handle missing values (imputation, deletion), duplicates, and outliers using Pandas.
- Perform EDA: calculate summary statistics, identify correlations (e.g., using .corr()), and visualize distributions.
- Practice on Kaggle datasets (e.g., “Customer Churn,” “Retail Sales,” or “Movie Ratings”).
Mini-Project: Analyze Netflix Data, Customer Churn, etc.
- Why It Matters: Python projects demonstrate advanced skills and are highly valued by recruiters for tech-heavy roles.
- Action Steps:
- Choose a dataset (e.g., Kaggle’s “Netflix Shows,” “Telco Customer Churn,” or “India Retail Sales”).
- Clean data (handle missing values, standardize formats), perform EDA (e.g., correlations, trends), and visualize insights (e.g., churn by customer segment).
- Create a Jupyter Notebook with code, visualizations, and a summary of findings (e.g., “Action movies have 20% higher ratings than dramas”).
- Upload to GitHub with a detailed README explaining the problem, approach, and results.
- Example Project: Analyze customer churn to identify high-risk segments, with visualizations of churn drivers and recommendations to reduce churn.
Month 5: Build Your Projects and GitHub Portfolio
Goal: Develop a professional portfolio with 2–3 strong projects to showcase expertise.
Complete 2–3 Strong Projects
- Why It Matters: A portfolio is your ticket to interviews, demonstrating hands-on skills in SQL, Python, and visualization. Recruiters prioritize candidates with tangible projects over certifications alone.
- Action Steps:
- Select diverse datasets to show versatility (e.g., finance, healthcare, e-commerce).
- Build projects combining multiple skills:
- Project 1: SQL + Visualization (e.g., retail sales dashboard with Tableau, querying data with SQL).
- Project 2: Python + EDA (e.g., customer churn analysis with Pandas and Seaborn).
- Project 3: End-to-End (e.g., analyze healthcare data with SQL for extraction, Python for EDA, Power BI for dashboard).
- Ensure each project answers a clear business question and includes actionable recommendations.
Add to GitHub with Clear README Files
- Why It Matters: A well-organized GitHub profile signals professionalism and makes your work accessible to hiring managers.
- Action Steps:
- Create a GitHub repository for each project.
- Write detailed READMEs including:
- Project title and business problem.
- Dataset description and source.
- Tools used (e.g., SQL, Python, Tableau).
- Step-by-step methodology (e.g., cleaning, analysis, visualization).
- Key findings and recommendations.
- Screenshots of visualizations or dashboards.
- Organize repositories with clear folder structures (e.g., /data, /code, /visuals).
Create a Notion or Personal Website Portfolio
- Why It Matters: A centralized portfolio makes it easy for recruiters to review your work, especially for remote or MNC roles.
- Action Steps:
- Use Notion (free) to create a portfolio page with:
- Brief bio and contact info.
- Links to GitHub projects with summaries.
- Embedded visuals or dashboards (e.g., Tableau Public links).
- Alternatively, build a simple website using Wix or WordPress (free templates) to showcase projects and your resume.
- Include a section on skills (e.g., SQL, Python, Tableau) and certifications (if any).
- Use Notion (free) to create a portfolio page with:
Month 6: Resume, LinkedIn, and Interview
Goal: Land interviews with a standout resume, magnetic LinkedIn, and polished interview skills.
ATS-Optimized Resume:
- Craft 1-page resume (Google Docs/Canva): Contact Info, Summary, Skills (SQL, Python, Tableau, Excel), Projects (e.g., “Dashboard drove 15% cost savings”), Education, Certifications.
- Use job description keywords to beat ATS.
- Tailor for each role.
LinkedIn Presence:
- Professional photo, headline (e.g., “Data Analyst | SQL, Python Expert”), summary showcasing projects.
- List skills, link GitHub, engage with data communities.
- Activate “Open to Work.”
Interview Excellence:
- Master 50–70 SQL queries (StrataScratch), Excel tasks (pivot tables), business cases (STAR method).
- Study KPIs, A/B testing.
- Mock interviews on Pramp, record answers, ask strategic questions.
Ready to Fast-Track Your Data Analyst Career?
Building the right skills step-by-step is key, but why do it alone? HCL GUVI’s Zen Class in Data Science Course is designed exactly for beginners like you who want a clear, practical path to becoming job-ready.
Unlike theory-heavy courses, this program is project-driven and hands-on. You’ll learn essential tools like Python, SQL, and data visualization, work on real-world datasets, and build a portfolio that stands out to recruiters.
Final thoughts
No matter how much you learn from blogs, videos, or podcasts, the first step towards mastering data analysis is applying what you learn through hands-on projects and real-world practice.
And by following this roadmap, you’ll build a strong foundation, develop relevant skills in the right order, and move confidently toward landing your first data analyst role.
FAQs
1. What is the roadmap for a data analyst?
Start with Excel and SQL, learn data visualization (Tableau/Power BI), master Python/R, study statistics, build real projects, learn business understanding, and gradually advance into machine learning and storytelling.
2. Can AI replace a data analyst?
AI can automate tasks like cleaning or reporting, but human analysts bring critical thinking, domain knowledge, and strategic decision-making. So, AI assists data analysts but doesn’t fully replace them.
3. What is the career path for a data analyst?
A typical path starts as a Junior Analyst, then Data Analyst, progressing to Senior Analyst, Business Intelligence Analyst, and potentially evolving into Data Scientist, Analytics Manager, or Product/Data Leader.
4. What is the salary of data analyst roadmap?
In India, entry-level analysts earn ₹4–6 LPA, mid-level get ₹8–12 LPA, and senior roles can go beyond ₹20 LPA, especially with skills in Python, SQL, and data visualization tools.
5. Does a data analyst have a future?
Absolutely. With data growing across industries, skilled analysts are in high demand. The role is evolving into more strategic decision-making, offering strong career growth and job security ahead.










I am Parmitha G.S from Panimalar Engineering College Chennai . now i have doing my 2 nd year .. I know about this GUVI from my College .. I came to Industrial visit with my College friends.. My goal to became a data analyst in top companies .. this Roadmap is help full and understandable for me ..