


Artificial Intelligence and Machine Learning Articles
Model Cards and Datasheets: Documenting AI Responsibly
AI Watermarking: Detecting AI-Generated Content


Get In Touch For Details! Request More Information
What is Statistical Power Analysis Explained
Sep 04, 2026 3 Min Read 15 Views
(Last Updated)
When conducting a statistical test, it is important to know whether the study has enough data to detect a meaningful effect. Statistical Power Analysis helps researchers determine how likely a statistical test is to detect an effect when that effect actually exists. It is commonly used to plan sample sizes, evaluate study designs, and understand the reliability of statistical results.
Table of contents
- TL;DR Summary
- What Is Statistical Power?
- Why Power Analysis Matters
- Key Factors in Power Analysis
- Sample Size
- Effect Size
- Significance Level
- Variability
- Power and Statistical Errors
- Type I Error
- Type II Error
- Example
- Types of Power Analysis
- A Priori Power Analysis
- Post Hoc Power Analysis
- Sensitivity Analysis
- Key Concepts to Remember
- A Practical Power Analysis Workflow
- Define the Research Question
- Select the Statistical Test
- Estimate the Effect Size
- Set the Significance Level
- Set the Desired Power
- Calculate the Required Sample Size
- Conduct the Study
- Analyze the Results
- Real-World Applications
- A/B Testing
- Clinical Research
- Product Analytics
- Machine Learning Experiments
- Best Practices
- Conclusion
- FAQs
- What is statistical power?
- What is the formula for statistical power?
- What is a Type II error?
- How does sample size affect statistical power?
- What is effect size?
- What is a common target for statistical power?
- When should power analysis be performed?
TL;DR Summary
- Statistical power is the probability of detecting a real effect.
- Power = 1 − β, where β is the probability of a Type II error.
- Sample size, effect size, significance level, and variability affect power.
- Power analysis can help determine an appropriate sample size.
- Higher power generally reduces the chance of missing a real effect.
Quick Answer
| Statistical Power Analysis is a method used to determine whether a statistical study has enough ability to detect an effect of a specified size. It considers factors such as sample size, effect size, significance level, and statistical power. Researchers commonly use power analysis before collecting data to estimate the sample size needed for a study. |
What Is Statistical Power?
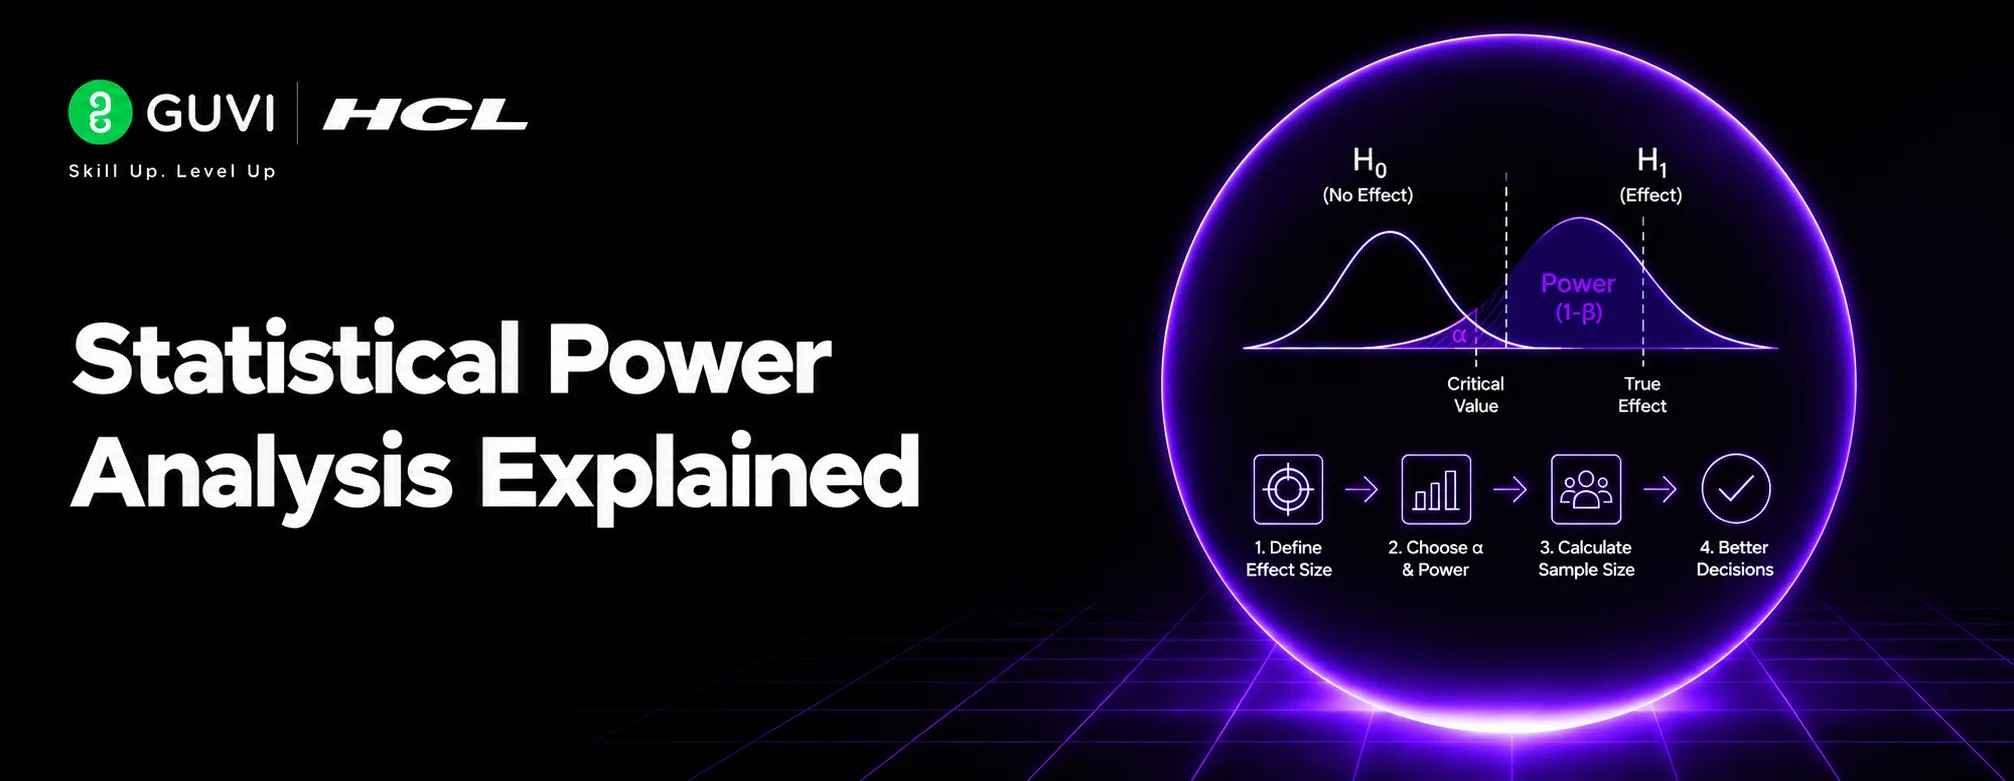
Statistical power is the probability that a statistical test will correctly reject the null hypothesis when a real effect exists.
It is represented as:
Power = 1 − β
where β represents the probability of a Type II error, or failing to detect a real effect.
For example, a study with 80% power has an 80% probability of detecting an effect of the specified size under the assumptions used for the calculation.
Why Power Analysis Matters
A study with too few observations may fail to detect a meaningful effect even when one exists.
Power analysis can help researchers:
- Plan sample sizes
- Design experiments
- Reduce underpowered studies
- Estimate detectable effects
- Assess statistical study designs
Key Factors in Power Analysis
Sample Size
Larger samples generally provide more information and can increase statistical power.
Effect Size
Effect size describes the magnitude of the difference or relationship being investigated.
Larger effects are generally easier to detect than very small effects.
Significance Level
The significance level (α) is the threshold used for statistical decision-making.
A commonly used value is:
α = 0.05
Changing α affects statistical power.
Variability
Greater variation in the data can make it harder to detect an effect, while lower variability can make differences easier to identify.
Power and Statistical Errors
Power analysis is closely related to the two main types of statistical errors.
Type I Error
A Type I error occurs when the null hypothesis is rejected even though it is true.
Its probability is commonly represented by α.
Type II Error
A Type II error occurs when the null hypothesis is not rejected even though a real effect exists.
Its probability is represented by β.
Therefore:
Power = 1 − β
Example
Suppose a company wants to test whether a new website design improves conversion rates.
The company needs to determine how many users should participate in the experiment.
A power analysis can consider:
- Expected effect size
- Desired statistical power
- Significance level
- Variability or other relevant assumptions
The result can help estimate an appropriate sample size before the experiment begins.
Types of Power Analysis
A Priori Power Analysis
Performed before collecting data to determine the required sample size.
Post Hoc Power Analysis
Performed after data collection using observed results.
However, researchers generally benefit more from planning power and sample size before data collection than relying on post hoc power calculations after a non-significant result.
Sensitivity Analysis
Determines what effect size can be detected given a fixed sample size, significance level, and desired power.
NumPy’s vectorized operations allow many calculations to be performed without writing explicit Python loops. This can make numerical code both more concise and more efficient. .
Key Concepts to Remember
- Statistical power is the probability of detecting a real effect.
- β represents the probability of a Type II error.
- Power = 1 − β.
- Effect size describes the magnitude of an effect.
- Sample size influences the ability to detect effects.
- α is the significance level.
- Power analysis is especially useful during study planning.

A Practical Power Analysis Workflow
1. Define the Research Question
Determine what difference or relationship you want to detect.
2. Select the Statistical Test
Choose the test that matches the research design and data.
3. Estimate the Effect Size
Determine what effect would be meaningful for the study.
4. Set the Significance Level
Choose an appropriate α, often 0.05.
5. Set the Desired Power
Select the desired probability of detecting the specified effect if it exists.
6. Calculate the Required Sample Size
Use the selected assumptions to estimate how much data is needed.
7. Conduct the Study
Collect data according to the planned design.
8. Analyze the Results
Perform the planned statistical analysis and interpret the results in context.
The HCL GUVI’s Artificial Intelligence eBook introduces artificial intelligence, machine learning, generative AI, and intelligent automation concepts, helping learners build a broader understanding of modern AI technologies.
Real-World Applications
A/B Testing
Estimate how many users are needed to detect a meaningful difference between two versions of a product.
Clinical Research
Help researchers plan participant numbers for studies comparing treatments or outcomes.
Product Analytics
Determine whether an experiment has enough observations to identify meaningful changes in user behavior.
Machine Learning Experiments
Power concepts can help when statistically comparing experimental conditions or model-related measurements, provided the observations and study design support such analysis.
Professionals interested in artificial intelligence, machine learning, statistics, and data science can strengthen their expertise through HCL GUVI’s Artificial Intelligence and Machine Learning Course.
Best Practices
- Perform power analysis before data collection when possible.
- Use a realistic estimate of the expected effect size.
- Choose the statistical test before calculating power.
- Consider variability in the population or measurements.
- Account for expected participant or observation loss when planning sample size.
- Avoid treating post hoc power as a substitute for proper study planning.
- Interpret power calculations together with the study design and assumptions.
Conclusion
Statistical Power Analysis helps researchers plan studies that have a reasonable ability to detect meaningful effects. Power depends on factors such as sample size, effect size, significance level, and variability. By conducting power analysis during study planning, researchers can make more informed decisions about sample size and reduce the risk of conducting studies that are unable to detect effects that genuinely exist.
FAQs
1. What is statistical power?
Statistical power is the probability that a statistical test will detect an effect when that effect actually exists.
2. What is the formula for statistical power?
The basic relationship is: Power = 1 − β, where β represents the probability of a Type II error.
3. What is a Type II error?
A Type II error occurs when a statistical test fails to reject the null hypothesis even though a real effect exists.
4. How does sample size affect statistical power?
Increasing sample size generally increases the ability of a study to detect an effect, assuming other factors remain appropriate.
5. What is effect size?
Effect size describes the magnitude of the difference, relationship, or effect being investigated.
6. What is a common target for statistical power?
80% power is a commonly used planning target, although the appropriate level depends on the study, consequences of errors, and research context.
7. When should power analysis be performed?
Power analysis is generally most useful before data collection, particularly when determining the sample size needed for a planned study.
Success Stories

About the Author
HCL GUVI
This article was selected and published as part of the HCL GUVI AI Blogathon 2026, an initiative designed to encourage students, AI enthusiasts, and aspiring tech writers to simplify complex AI concepts through impactful technical content. The contest recognized high-quality, original, and insightful AI-focused blogs, with selected authors receiving publication opportunities on the HCL GUVI blog platform along with official author credits and recognition.
View all posts by HCL GUVI
Connect with me @












Did you enjoy this article?