


Artificial Intelligence and Machine Learning Articles
AI/ML Skills Gap 2026: Why Companies Can't Find Job-Ready Talent
20 AI/ML Interview Questions Recruiters Can Use Without a Tech Background - Best Guide
How Industry-Backed AI/ML Bootcamps Are Changing the AI/ML Hiring Pipeline - Best Guide 2026
From IT Support to AI Engineer: A Realistic Career Switch Guide 2026


Get In Touch For Details! Request More Information
How to Use Claude for Log Analysis and Error Diagnosis
Aug 04, 2026 3 Min Read 239 Views
(Last Updated)
Claude is a powerful tool for log analysis and error diagnosis because it can quickly identify patterns, root causes, and potential fixes from complex log files. It works best when you provide structured logs, focus on relevant sections, and guide it through a systematic analysis process from evidence to fix.
Table of contents
- TL;DR Summary
- The Challenge With Manual Log Review
- How Claude Helps
- Getting Started With Log Analysis
- Step 1: Structure Your Logs
- Step 2: Store Logs Properly
- Step 3: Extract Relevant Sections
- Best Practices for Error Diagnosis
- Use Structured JSON Logs
- Hand Over Evidence First
- Confirm Before Fixing
- Fix Narrowly, Then Verify
- Pro Tips for Better Results
- Limit Log Input Size
- Use micro prompts.
- Add Targeted Logging
- Automate the Workflow
- Building Your Analysis Workflow
- Common Mistakes to Avoid
- Real-World Workflow
- Conclusion
- FAQs
- How many lines of logs should I paste to Claude
- Can Claude analyze structured JSON logs
- How do I get Claude to trace root cause
- Can I automate log analysis with Claude
- Do I still need to verify fixes manually
TL;DR Summary
- How to use Claude for log analysis and error diagnosis involves pasting structured logs, asking Claude to trace errors to root causes, and getting targeted fixes instead of broad rewrites.
- Focus on 30-50 lines of relevant logs, use a step-by-step prompt sequence, and always verify fixes before deploying.
Use Claude to spot root causes and fix patterns in logs and error traces faster. Learn DevOps fundamentals with HCL GUVI’s Fundamentals of DevOps.
Why Use Claude for Log Analysis

The Challenge With Manual Log Review
Production errors often come with massive stack traces and thousands of log lines. Manually scrolling through logs to find the root cause is time-consuming and error-prone, especially during critical incidents at 2 AM.
How Claude Helps
Claude can analyze logs, identify patterns, and trace errors to their root cause in seconds. It cross-references logs with your codebase to propose specific fixes, turning hours of debugging into minutes of focused analysis.
Getting Started With Log Analysis
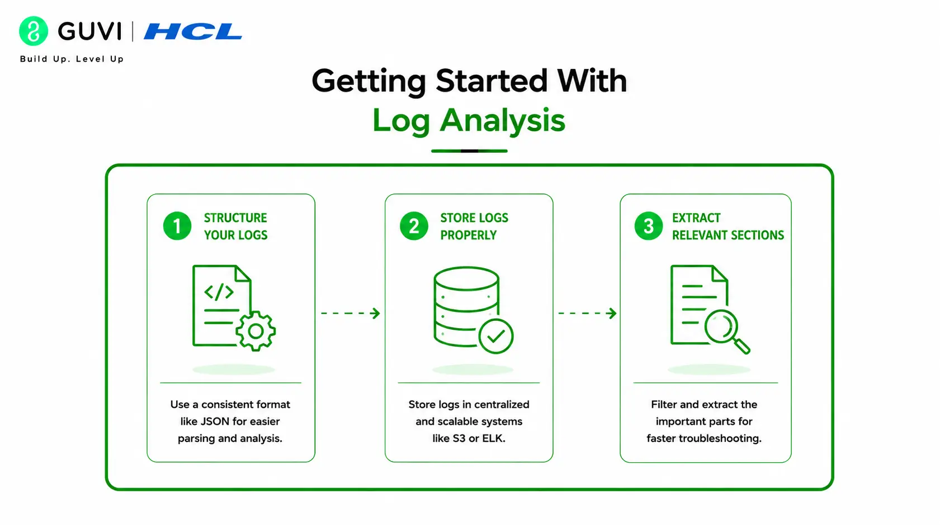
Step 1: Structure Your Logs
Use a logging library like Winston for Node.js or similar tools for other languages. Implement structured JSON logs that include error messages, stack traces, routes, and user IDs for better clarity and analysis.
Step 2: Store Logs Properly
In production, store logs in a centralized system like CloudWatch, Datadog, or Sentry. This makes it easy to retrieve logs when errors occur and pass them to Claude for analysis.
Step 3: Extract Relevant Sections
When using Claude, don’t paste entire log files. Focus on relevant sections like error spikes, repeating patterns, or suspicious logs. Limit input to about 30 to 50 lines for effective processing.
Best Practices for Error Diagnosis
1. Use Structured JSON Logs
Structured logs are much easier for Claude to analyze than plain text. Include details like timestamps, error levels, messages, stack traces, and contextual information in JSON format.
2. Hand Over Evidence First
Start by pasting the full error and stack trace. Ask Claude to trace it to the root cause and explain why it happens before suggesting any fixes. This ensures it understands the problem deeply.
3. Confirm Before Fixing
Before changing code, ask Claude what the smallest change is that fixes the root cause without touching unrelated code. List the exact files and lines it will edit to ensure surgical precision.
4. Fix Narrowly, Then Verify
Make only the targeted change. Then ask Claude how to reproduce the original error to confirm it’s actually gone. Don’t just assert it’s fixed; verify with actual testing.
Pro Tips for Better Results
1. Limit Log Input Size
Keep your log input to about 30 to 50 lines focusing on the most relevant sections. This ensures Claude can process the information effectively without getting overwhelmed.
2. Use micro prompts.
Use specific prompts like “Analyze these logs to identify root cause and patterns” or “Trace this error to the line that fails and explain why.” Clear instructions yield better results.
3. Add Targeted Logging
If the trace is thin, don’t let Claude guess. Have it add targeted logging first, reproduce the bug, then read the new output for clearer diagnosis.
4. Automate the Workflow
Create scripts that retrieve logs from CloudWatch, Datadog, or Sentry, format them, and pass them to Claude automatically. Schedule this with cron or GitHub Actions for continuous monitoring.
Building Your Analysis Workflow

- Use scripts to hit logging APIs like Sentry or CloudWatch and retrieve logs in JSON format. Save them to a file that Claude can read and analyze.
- Convert logs into a format that Claude can process effectively. Use a CLAUDE.md file to convey project context and prerequisite knowledge to Claude Code.
- Ask Claude to analyze the stack trace, identify relevant source code, and propose a root cause with a fix patch in diff format. This gives you actionable results.
- Automatically post the proposal content to Slack or GitHub Issues for team visibility. This integrates log analysis into your existing workflow and speeds up resolution.

Common Mistakes to Avoid
- Avoid pasting excessively long log sections. Focus on relevant parts like error spikes, repeating patterns, or suspicious logs for effective analysis.
- Don’t let Claude jump straight to fixing. Have it trace the error to the root cause first and explain why it happens before suggesting any changes.
- Avoid shotgun rewrites that touch unrelated code. Ask for the smallest change that fixes the root cause to minimize risk and side effects.
- Always verify fixes by reproducing the original error. Don’t just assert it’s fixed; confirm with actual testing that the issue is resolved.
Use Claude to spot root causes and fix patterns in logs and error traces faster. Learn DevOps fundamentals with HCL GUVI’s Fundamentals of DevOps.
Claude can analyze Linux logs from journalctl, syslog, and application logs, turning thousands of lines into a clear diagnosis in seconds. It can also automatically generate scripts that scan logs, detect repeated errors, and alert you when thresholds are reached.
Real-World Workflow
- An alert goes off in production. You retrieve the error logs from your logging infrastructure and pass the relevant sections to Claude for immediate analysis.
- Claude traces the error to a specific line in your code, explains why it fails, and proposes the smallest fix that addresses the root cause without touching unrelated code.
- You apply the fix, reproduce the original error scenario, and confirm it’s actually gone. The issue is resolved in minutes instead of hours of manual debugging.
Conclusion
How to use Claude for log analysis and error diagnosis transforms debugging from hours of manual scrolling into minutes of focused analysis. The key is providing structured logs, following a systematic prompt sequence from evidence to fix, and always verifying changes before deploying to production
FAQs
1. How many lines of logs should I paste to Claude
Limit your input to about 30 to 50 lines, focusing on relevant sections like error spikes, repeating patterns, or suspicious logs for effective analysis.
2. Can Claude analyze structured JSON logs
Yes, structured JSON logs are much easier for Claude to analyze than plain text. Include timestamps, error levels, messages, and contextual information.
3. How do I get Claude to trace root cause
Ask Claude to trace the error to the root cause and explain why it happens before suggesting any fixes. This ensures deep understanding of the problem.
4. Can I automate log analysis with Claude
Yes, create scripts that retrieve logs from CloudWatch, Datadog, or Sentry, format them, and pass them to Claude automatically via cron or GitHub Actions.
5. Do I still need to verify fixes manually
Yes, always verify fixes by reproducing the original error. Don’t just assert it’s fixed; confirm with actual testing that the issue is resolved.
Success Stories

About the Author
HCL GUVI
This article was selected and published as part of the HCL GUVI AI Blogathon 2026, an initiative designed to encourage students, AI enthusiasts, and aspiring tech writers to simplify complex AI concepts through impactful technical content. The contest recognized high-quality, original, and insightful AI-focused blogs, with selected authors receiving publication opportunities on the HCL GUVI blog platform along with official author credits and recognition.
View all posts by HCL GUVI
Connect with me @













Did you enjoy this article?