


Business Analytics Articles
Data Visualization in Business Analytics: Choosing the Right Chart for Business Decisions
Data Integration in Business Analytics: Methods, Tools and Best Practices
Is Business Analyst a Good Career? An Honest Look at the Pros, Cons, and Who Should Skip It
Best Platforms to Practice Business Analyst Case Study Interview Questions in 2026


Get In Touch For Details! Request More Information
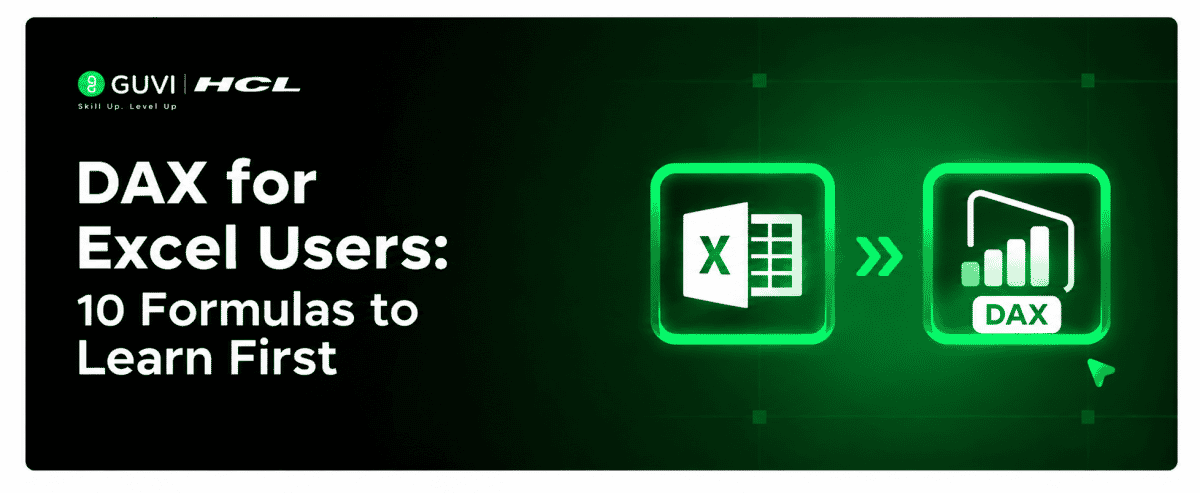
DAX for Excel Users: 10 Formulas to Learn First
Nov 17, 2026 6 Min Read 71 Views
(Last Updated)
Already comfortable with Excel formulas but struggling to understand DAX in Power BI? The good news is that many familiar Excel concepts also apply to DAX, including SUM, IF, and logical calculations.
DAX for Excel users becomes easier once you understand how formulas work with tables, relationships, and filters instead of individual spreadsheet cells.
DAX, or Data Analysis Expressions, helps you calculate revenue, analyze customer behaviour, compare performance, and build dynamic business dashboards.
However, you do not need to learn hundreds of functions immediately.
This guide explains 10 essential DAX formulas with practical business examples, their Excel equivalents, and tips for applying them in Power BI.
Table of contents
- TL;DR
- Quick Answer
- What Is DAX and How Is It Different From Excel?
- What Should Excel Users Understand Before Learning DAX?
- Measures vs Calculated Columns
- Row Context vs Filter Context
- 10 Essential DAX Formulas for Excel Users
- SUM() to Calculate Total Revenue
- COUNTROWS() to Count Transactions
- DISTINCTCOUNT() to Count Unique Orders
- DIVIDE() to Calculate Average Order Value
- CALCULATE() to Analyze Specific Categories
- FILTER() to Analyze High-Value Sales
- SUMX() to Calculate Revenue From Quantity and Price
- IF() to Track Sales Targets
- RELATED() to Retrieve Data From Another Table
- DATEADD() to Compare Previous-Month Revenue
- Excel vs DAX Formulas
- How to Practice DAX in Power BI
- Step 1. Import a Sales Dataset
- Step 2. Create Basic Measures
- Step 3. Build Business KPIs
- Step 4. Practice Advanced Calculations
- Step 5. Build an Interactive Dashboard
- Conclusion
- FAQs
- Is DAX Easy to Learn if I Know Excel?
- What Are the Most Important DAX Formulas for Beginners?
- What Is the Difference Between Excel Formulas and DAX?
- What Is the Difference Between a Measure and a Calculated Column in DAX?
- Do I Need to Learn DAX to Use Power BI?
- How Long Does It Take to Learn DAX for Power BI?
TL;DR
DAX for Excel users starts with familiar formulas before introducing advanced calculations in Power BI.
- Basic Calculations: SUM, COUNTROWS, DISTINCTCOUNT.
- Business KPIs: DIVIDE and CALCULATE.
- Data Analysis: FILTER and SUMX.
- Conditional Logic: IF.
- Table Relationships: RELATED.
- Time Intelligence: DATEADD.
- Practice: Use sales data to calculate revenue, order counts, and monthly trends.
Quick Answer
| DAX for Excel users is easier to learn by starting with familiar functions like SUM, IF, and SUMX before moving to CALCULATE, FILTER, and DATEADD. The 10 essential formulas include SUM, COUNTROWS, DISTINCTCOUNT, DIVIDE, CALCULATE, FILTER, SUMX, IF, RELATED, and DATEADD. Understanding measures, filter context, and table relationships helps you calculate KPIs, analyze sales, and build interactive Power BI reports. |
What Is DAX and How Is It Different From Excel?
DAX (Data Analysis Expressions) is a formula language used in Power BI, Power Pivot in Excel, and Analysis Services to perform calculations on data models.
Excel formulas typically work with individual cells or ranges. DAX works with tables, columns, relationships, and calculation contexts.
For example, Excel users might calculate revenue using:
=SUM(E2:E100)The equivalent DAX measure could be:
Total Revenue = SUM(Sales[Revenue])The main difference is how these formulas respond to data.
A DAX measure automatically recalculates based on the relevant filters in your report. Selecting a product category or region can change the displayed revenue without rewriting the formula.
According to Microsoft’s DAX documentation, DAX supports calculations using functions, operators, and values across related tables.
Learning DAX helps Excel users perform advanced calculations, analyse business metrics, and create more insightful Power BI reports. Strengthen your data interpretation, KPI analysis, and business reporting skills with HCL GUVI’s Business Analytics Course. Build the analytical foundation needed to support data-driven business decisions.
What Should Excel Users Understand Before Learning DAX?
Before practising DAX for Excel users, understand two essential concepts.
Measures vs Calculated Columns
- Measures: Calculate results dynamically based on report filters. They are useful for KPIs such as total revenue and average order value.
- Calculated Columns: Calculate values for individual rows and store them in the data model. They are useful for categorization and row-level calculations.
Row Context vs Filter Context
Row context refers to the current row being evaluated, while filter context determines which data contributes to a calculation.
For example, a region slicer changes the filter context of a revenue measure.
Understanding these concepts makes advanced formulas such as CALCULATE and SUMX easier to use.
- DAX also works in Excel Power Pivot, so Excel users can apply data modeling concepts without learning an entirely unrelated formula language.
- DAX measures respond to report filters and slicers, helping analysts reuse one calculation across multiple report views.
- Power BI Quick Measures can generate DAX formulas automatically, allowing beginners to study and customize the underlying calculations.
10 Essential DAX Formulas for Excel Users
Let us use one sample e-commerce dataset throughout this tutorial.
Assume your Power BI model contains:
- Sales: OrderID, OrderDate, CustomerID, ProductID, Quantity, UnitPrice, Revenue.
- Products: ProductID, Category.
- Calendar: Date.
Each Sales row represents one order line. Products and Calendar have relationships with Sales through ProductID and OrderDate, respectively.
These examples use New measure unless a calculated column is specified.
1. SUM() to Calculate Total Revenue
The SUM() function adds numerical values from a column.
Excel Equivalent: SUM()
DAX Formula
Total Revenue = SUM(Sales[Revenue])How It Works: The formula adds the revenue values for all sales records included in the current filter context.
Business Example: A retail manager wants to monitor total monthly revenue across different product categories.
Add this measure to a Power BI card or chart to display the relevant sales total.
What to Learn: Column references and basic aggregation.
2. COUNTROWS() to Count Transactions
COUNTROWS() counts the number of rows in a table.
Excel Equivalent: Similar to COUNTA() when each relevant row represents a populated record.
DAX Formula
Total Order Lines = COUNTROWS(Sales)How It Works: The measure counts sales line items included in the current filter context.
Business Example: An e-commerce business wants to track the number of product line items processed each month.
Important: One order may contain several products. Therefore, counting sales rows does not necessarily give the number of unique orders.
What to Learn: Distinguishing record counts from business KPIs.
3. DISTINCTCOUNT() to Count Unique Orders
DISTINCTCOUNT() counts unique values in a column.
Excel Equivalent: Similar to combining UNIQUE() and COUNTA() for a cleaned list without blanks.
DAX Formula
Total Orders = DISTINCTCOUNT(Sales[OrderID])How It Works: Repeated order IDs are counted once.
Business Example: A sales manager wants to measure the actual number of customer orders rather than individual product line items.
This measure is also useful for calculating average order value.
What to Learn: Unique counts and the importance of selecting the correct business metric.
4. DIVIDE() to Calculate Average Order Value
DIVIDE() divides one value by another and handles division by zero safely.
Excel Equivalent: Similar to division combined with IFERROR().
DAX Formula
Average Order Value =
DIVIDE([Total Revenue], [Total Orders])
How It Works: The formula divides total revenue by the number of unique orders.
If the denominator is zero, DIVIDE returns BLANK by default instead of producing a division error.
Business Example: An online retailer wants to understand how much customers spend per order.
What to Learn: Reusing measures and calculating business ratios.
5. CALCULATE() to Analyze Specific Categories
CALCULATE() evaluates an expression within a modified filter context.
It is one of the most important functions in DAX.
Excel Equivalent: Some calculations resemble SUMIFS(), although CALCULATE supports more flexible filtering.
DAX Formula
Electronics Revenue =
CALCULATE(
    [Total Revenue],
    Products[Category] = "Electronics"
)
How It Works: The formula calculates revenue for the Electronics category using the relationship between Products and Sales.
Business Example: A manager wants to compare electronics revenue with other product categories.
What to Learn: Filter context and calculating KPIs for specific business segments.
6. FILTER() to Analyze High-Value Sales
FILTER() returns a subset of a table based on a specified condition.
Excel Equivalent: Similar in purpose to FILTER(), but DAX uses the result as a table expression.
DAX Formula
High-Value Line Revenue =
CALCULATE(
    [Total Revenue],
    FILTER(
        Sales,
        Sales[Revenue] > 10000
    )
)
How It Works: The formula calculates revenue from sales line items whose individual revenue exceeds 10,000.
Business Example: A sales team wants to examine the contribution of high-value line items to total revenue.

What to Learn: Applying row-level conditions within calculations.
Practical Tip: Simple column conditions can often be passed directly to CALCULATE without FILTER. Use FILTER when you need more complex table-based logic.
7. SUMX() to Calculate Revenue From Quantity and Price
SUMX() evaluates an expression for each row and adds the results.
Excel Equivalent: Similar to SUMPRODUCT().
DAX Formula
Calculated Revenue =
SUMX(
    Sales,
    Sales[Quantity] * Sales[UnitPrice]
)
How It Works: The formula multiplies quantity by unit price for each sales line and then adds the results.
Business Example: A retailer wants to calculate gross line-item revenue using quantity and selling price.
Important: This example assumes no discounts or other adjustments. Actual reported revenue may differ when those factors apply.
What to Learn: Row-by-row calculations using iterator functions.
8. IF() to Track Sales Targets
IF() evaluates a condition and returns one result when it is true and another when it is false.
Excel Equivalent: IF()
DAX Formula
Sales Target Status =
IF(
    [Total Revenue] >= 100000,
    "Target Met",
    "Below Target"
)
How It Works: The measure checks whether revenue in the current report context meets the target of 100,000.
Business Example: A sales manager wants a dashboard indicator showing whether a selected region has achieved its revenue target.
What to Learn: Conditional calculations and performance indicators.
9. RELATED() to Retrieve Data From Another Table
RELATED() retrieves a value from a related lookup table.
Excel Equivalent: Similar to XLOOKUP() or VLOOKUP(), although DAX relies on model relationships.
DAX Formula
Create this as a calculated column in the Sales table:
Product Category =
RELATED(Products[Category])
How It Works: The formula retrieves each product’s category from the Products table.
An appropriate relationship between the tables must already exist.
Business Example: A sales analyst wants to identify the category associated with every transaction.
What to Learn: Data modeling and table relationships.
10. DATEADD() to Compare Previous-Month Revenue
DATEADD() shifts a set of dates backward or forward by a specified interval.
Excel Equivalent: Excel date functions can shift dates, but DAX combines time-based calculations with report filtering.
DAX Formula
Previous Month Revenue =
CALCULATE(
    [Total Revenue],
    DATEADD('Calendar'[Date], -1, MONTH)
)
How It Works: The measure evaluates revenue for the corresponding dates one month earlier.
Business Example: A retailer wants to compare current-month revenue against the previous month in a Power BI chart.
Important: Use a properly related date table containing continuous dates across the required reporting periods. The example assumes your calendar and date filters are configured correctly.
What to Learn: Time intelligence and period-based performance comparisons.
Excel vs DAX Formulas
The following comparison helps Excel users understand where familiar functions fit into Power BI.
| Excel Function or Technique | DAX Function | Common Application |
|---|---|---|
| SUM | SUM | Total revenue |
| COUNTA | COUNTROWS | Record counting |
| UNIQUE + COUNTA | DISTINCTCOUNT | Unique order counting |
| Division + IFERROR | DIVIDE | Average order value |
| SUMIFS | CALCULATE | Filtered revenue |
| FILTER | FILTER | Conditional data selection |
| SUMPRODUCT | SUMX | Quantity × price |
| IF | IF | Performance status |
| XLOOKUP | RELATED | Related table values |
| Date calculations | DATEADD | Period comparisons |
| Key Takeaway: Many Excel concepts transfer to DAX, but DAX formulas depend on model relationships, row context, and filter context. |
How to Practice DAX in Power BI
The best way to learn DAX for Excel users is to build a small business report using familiar data.
Follow these five steps.
Step 1. Import a Sales Dataset
Open Power BI Desktop and import a structured Excel sales workbook.
Use the Microsoft Financial Sample Workbook or another dataset containing relevant sales information.
Step 2. Create Basic Measures
Start with SUM, COUNTROWS, and DISTINCTCOUNT.
Check that the measures return the expected totals.
Step 3. Build Business KPIs
Use DIVIDE and CALCULATE to create metrics such as average order value and category-specific revenue.
Step 4. Practice Advanced Calculations
Use SUMX, FILTER, and RELATED with a suitable relational data model.
Create a date table for time intelligence calculations.
Step 5. Build an Interactive Dashboard
Add KPI cards, monthly revenue charts, and product category filters.
Test how the calculations change when you select different reporting periods.
Also Read: Top PowerBI Resources
Pro Tip: Use Power BI’s Quick Measures feature to generate common DAX calculations and inspect the formulas. It is a practical way to learn unfamiliar syntax.
Mastering DAX formulas is a valuable step towards becoming proficient in Power BI and business analytics. Develop your understanding of business requirements, performance metrics, and analytical problem-solving with HCL GUVI’s Business Analytics Course. Prepare to turn complex data into meaningful business insights.
Conclusion
Learning DAX for Excel users becomes easier when you start with familiar formulas such as SUM and IF before moving to CALCULATE, SUMX, and DATEADD.
The biggest adjustment is understanding how measures, tables, relationships, and filter context work together.
Start with basic calculations, practise using realistic sales data, and gradually build more complex business metrics.
These 10 DAX formulas provide a practical foundation for creating accurate Power BI reports and improving your business analytics skills.
FAQs
Is DAX Easy to Learn if I Know Excel?
Yes. Familiarity with Excel formulas such as SUM, IF, and SUMPRODUCT can help you understand DAX. However, you also need to learn filter context, measures, and table relationships.
What Are the Most Important DAX Formulas for Beginners?
Start with SUM, COUNTROWS, DISTINCTCOUNT, DIVIDE, and CALCULATE. Then learn FILTER, SUMX, IF, RELATED, and DATEADD for more advanced business calculations.
What Is the Difference Between Excel Formulas and DAX?
Excel formulas typically work with cells and ranges, while DAX operates on tables, columns, relationships, and data models. DAX measures also respond dynamically to report filters.
What Is the Difference Between a Measure and a Calculated Column in DAX?
A measure calculates results dynamically based on filter context. A calculated column evaluates an expression for each row and stores the results in the model.
Do I Need to Learn DAX to Use Power BI?
You can create basic Power BI visuals without writing DAX. However, learning DAX helps you calculate custom KPIs, filtered metrics, and time-based comparisons.
How Long Does It Take to Learn DAX for Power BI?
Excel users may learn basic DAX formulas within a few weeks of regular practice. More advanced concepts, including filter context and time intelligence, require additional hands-on experience.
Success Stories

About the Author
Vaishali
I'm a seasoned writer with four years of experience across technical, non-technical, and just about every genre or niche you can imagine. Adaptable and curious, I enjoy exploring new topics and making information engaging and easy to understand. Fueled by a steady stream of tea, I approach each project with creativity, reliability, and genuine enthusiasm for storytelling.
View all posts by Vaishali
Connect with me @










Did you enjoy this article?