What Is Correlation in Data Science? A Guide for Beginners
Sep 21, 2024 5 Min Read 2399 Views
(Last Updated)
Data Science is not just about studying data, it is a combination of various fields such as statistics, visualization, data study, and so on. You have to master all these fields in order to master data science.
From the statistical point of view, there is an important concept that you as a data scientist should know at all costs and that topic is, correlation in data science. This will help you conduct mathematical applications on data and come up with a solution.
So, if you feel like this is overwhelming or confusing, no worries, this article will guide you throughout and make it easy for you to understand everything about correlation in data science. Let us get started.
Table of contents
- What is Correlation in Data Science?
- Types of Correlation in Data Science
- How Do We Measure Correlation in Data Science?
- The Correlation Coefficient (r)
- Understanding the Strength and Direction
- How to Calculate Correlation in Data Science?
- Using Pearson's Correlation Coefficient
- Using Tools Like Excel or Google Sheets
- Using Python for Calculation
- Key Points to Remember
- Why is Correlation in Data Science Important?
- Real-World Applications of Correlation in Data Science
- Conclusion
- FAQs
- What is the difference between correlation and causation?
- What is the significance of the correlation coefficient’s magnitude?
- How does correlation relate to regression analysis?
- How do you interpret a correlation coefficient of zero?
What is Correlation in Data Science?
At its core, correlation is a statistical measure that describes the relationship between two variables. Think of it as a way to see how two things are connected.
For example, if you notice that ice cream sales tend to go up when the temperature rises, you’re observing a correlation between these two variables: temperature and ice cream sales.
But it’s not just about noticing a connection. Correlation in data science quantifies the strength and direction of that relationship. This means it can tell you not only if two variables are related but also how strong that relationship is and whether one variable tends to increase or decrease as the other does.
Types of Correlation in Data Science
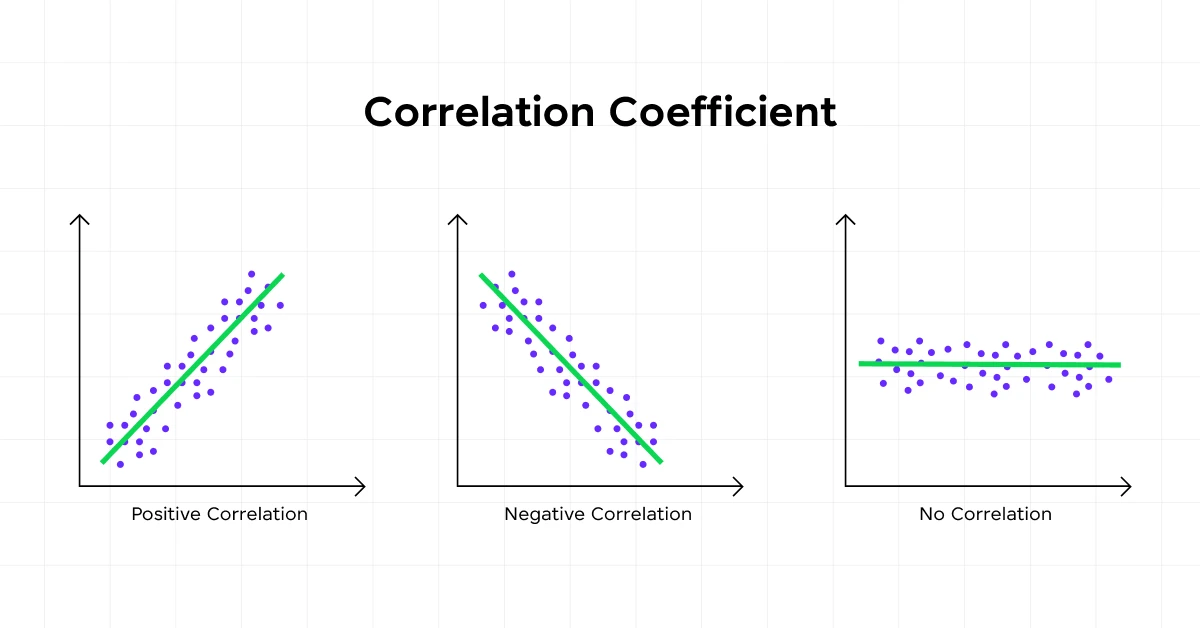
There are three main types of correlation in data science: positive, negative, and zero.
- Positive Correlation: This occurs when both variables move in the same direction. For example, the more hours you study, the higher your test scores tend to be. Both studying and scores are increasing together.
- Negative Correlation: Here, the variables move in opposite directions. An example could be the relationship between the amount of time spent watching TV and grades. Typically, as TV time increases, grades might decrease.
- Zero Correlation: This means there’s no relationship between the variables. For example, there might be no correlation between the number of books you read and the color of your car.
These types of correlation in data science help you determine what category, two variables fall under. This way of understanding the relation of data falls under the analysis of data in the Data Process lifecycle.
How Do We Measure Correlation in Data Science?

With the help of the previous section, you may have a basic understanding of what correlation in data science is and what are its types. Now, let’s get into the details of how you can measure correlation.
But before we go any further if you want to learn and explore more about Data Science and want to become a data scientist, consider enrolling in a professionally certified online Data Science Course that teaches you everything about data and helps you get started as a data scientist.
It is time for you to get right into the topic of the day, measuring correlation in data science:
The most common way to measure correlation is with something called the correlation coefficient, often represented by the letter “r.” This coefficient gives you a numerical value that describes the strength and direction of the relationship between two variables.
The Correlation Coefficient (r)
The correlation coefficient, or “r,” is a number that ranges from -1 to 1. Here’s what those values mean:
- r = 1: This indicates a perfect positive correlation. In simpler terms, it means that as one variable increases, the other increases in a perfectly consistent way. Imagine you’re looking at the relationship between the amount of time spent exercising and the number of calories burned. If every extra minute of exercise consistently burns a certain number of extra calories, you’d see an r-value of 1.
- r = -1: This indicates a perfect negative correlation. It means that as one variable increases, the other decreases in a perfectly consistent way. For instance, think about the relationship between the number of hours you sleep and how tired you feel the next day. If getting more sleep always makes you feel less tired, you’d see an r value of -1.
- r = 0: This means there’s no correlation between the variables. Basically, one variable doesn’t predict the other at all. An example might be the relationship between how many books you read in a year and the number of times you visit the beach. There’s probably no connection there, so the r value would be close to zero.
Understanding the Strength and Direction
The value of r also tells you about the strength and direction of the relationship.
- If r is close to 1 or -1, the relationship is strong, meaning the variables are closely related.
- If r is closer to 0, the relationship is weak, meaning the variables aren’t closely related.
The sign of r (+ or -) tells you the direction of the relationship. A positive sign means that as one variable goes up, the other also goes up. A negative sign means that as one goes up, the other goes down.
Now, you might be wondering, “How do I actually calculate this r value?” While there are formulas to do this by hand, like Pearson’s correlation coefficient formula, most people use software like Excel, Google Sheets, or programming languages like Python.
These tools can calculate the correlation coefficient quickly and accurately.
But don’t worry about the math too much. The key is understanding what the numbers mean and how to interpret them. When you see an r value, you now know it’s telling you how strong the relationship is and whether the variables move together or in opposite directions.
If you are just getting started with Python and want to excel in it, consider joining GUVI’s Python course which lets you learn and get certified at your own pace.
How to Calculate Correlation in Data Science?

We gave a gist on the calculation of correlation in data science in the previous section. Moreover, now that you’ve got a good grasp of what correlation in data science is and how it’s measured, let’s dive into how you can actually calculate it.
While the idea of calculating correlation in data science might seem a bit intimidating, don’t worry—it’s more straightforward than it seems. You can use tools like spreadsheets or programming languages, but we’ll also break down the basic concept here so you can understand what’s happening behind the scenes.
Using Pearson’s Correlation Coefficient
The most common method to calculate correlation is using Pearson’s correlation coefficient. This formula gives you the “r” value, which tells you how strong and in which direction the two variables are related. Here’s a simplified way to understand the calculation:
- Collect Your Data: First, you’ll need two sets of data that you want to compare. Let’s call them Variable X and Variable Y. For example, you might have data on the number of hours studied (X) and the test scores (Y).
- Calculate the Mean: Find the average (mean) of each variable. The mean is just the sum of all the values divided by the number of values. So, if you have data on hours studied like 2, 3, 5, and 6 hours, the mean would be (2+3+5+6)/4 = 4 hours.
- Find the Differences from the Mean: For each value in your data sets, subtract the mean of that variable. This gives you a set of “deviations” for each variable. If you studied 5 hours and the mean was 4, the deviation for that data point is 5 – 4 = 1.
- Multiply the Deviations: For each pair of values (one from each variable), multiply their deviations from the mean together. If one variable’s deviation is 1 and the other’s is 2, you’d get 1 * 2 = 2.
- Sum Up the Products: Add up all the products of deviations you calculated in the previous step.
- Calculate the Squares of Deviations: For each variable separately, square the deviations (multiply them by themselves) and sum those squares. This step is about understanding the variability in each dataset.
- Plug Into the Formula: Finally, you’ll use the Pearson correlation coefficient formula:

This formula might look complicated, but it’s just a way of standardizing the sum of the multiplied deviations by the variability in each dataset.
Using Tools Like Excel or Google Sheets
If the manual calculation sounds like a lot, you’re in luck! Tools like Excel or Google Sheets have built-in functions to do the heavy lifting for you. Here’s how you can do it with these tools:
- Input Your Data: Enter your data into two columns, one for each variable.
- Use the CORREL Function: In Excel or Google Sheets, use the function
'=CORREL(array1, array2)'. Replacearray1andarray2with your data ranges.
For example, if your data is in cells A1 and B1, you’d use'=CORREL(A1:A10, B1:B10)'. - Interpret the Result: The function will give you the “r” value, telling you the strength and direction of the correlation.
Using Python for Calculation
For those of you who prefer programming, Python offers a powerful way to calculate correlation using libraries like Pandas. Here’s a quick guide:
- Import Your Data: Load your data into a DataFrame using Pandas.
- Use the .corr() Method: Call the
.corr()method on your DataFrame or between two series. For example,data['variable1'].corr(data['variable2'])will give you the correlation coefficient.
Key Points to Remember
- Direction Matters: A positive r means that as one variable increases, so does the other. A negative r means that as one increases, the other decreases.
- Strength Matters: The closer the r value is to 1 or -1, the stronger the correlation. Values close to 0 indicate a weak or no correlation.
- Correlation Doesn’t Equal Causation: Always remember, just because two variables are correlated doesn’t mean one causes the other. Other factors could be at play!
By now, you should feel more confident about calculating and understanding correlation in data science. Whether you’re using it to make business decisions, analyze scientific data, or just understand the world around you, this concept is a powerful tool in your data science toolkit.
Why is Correlation in Data Science Important?
Understanding correlation in data science is key to analyzing data and making informed decisions. For example, businesses can use correlation in data science to understand customer behavior.
If a company notices a strong positive correlation between customer satisfaction scores and repeat purchases, it can focus on improving satisfaction to boost sales.
But here’s a critical point: correlation does not imply causation. Just because two variables are correlated doesn’t mean one causes the other.
For example, ice cream sales and drownings might both increase in the summer, but eating more ice cream doesn’t cause drowning. The common factor here is the warmer weather.
Real-World Applications of Correlation in Data Science

In the real world, correlation in data science is used in countless fields:
- Healthcare: Researchers study the correlation between lifestyle factors (like diet and exercise) and health outcomes to develop public health recommendations.
- Education: Educators analyze correlations between teaching methods and student performance to improve educational practices.
- Marketing: Marketers use correlation to understand consumer behavior and optimize their campaigns.
- Sports: Coaches and analysts use correlation to improve player performance and strategize for games.
By understanding these relationships, you can better understand complex systems and make more informed decisions with the help of correlation in data science.
If you want to learn more about Data science and its implementation in the real world, then consider enrolling in GUVI’s Certified Data Science Course which not only gives you theoretical knowledge but also practical knowledge with the help of real-world projects.
Conclusion
In conclusion, understanding correlation in data science is crucial for understanding relationships between variables, making informed decisions, and predicting future outcomes.
While correlation in data science helps identify patterns and trends, it’s important to remember that it doesn’t imply causation.
By using correlation wisely, you can navigate complex data sets and gain valuable insights, whether you’re analyzing business metrics, health data, or everyday observations.
FAQs
1. What is the difference between correlation and causation?
Correlation measures the relationship between two variables, while causation indicates that one variable directly affects another. Correlation does not imply causation.
2. What is the significance of the correlation coefficient’s magnitude?
The magnitude indicates the strength of the relationship: closer to ±1 means a strong correlation, while closer to 0 means weak or no correlation.
3. How does correlation relate to regression analysis?
While correlation measures the strength of a relationship, regression analysis estimates how one variable affects another, helping to predict outcomes.
4. How do you interpret a correlation coefficient of zero?
A correlation coefficient of zero indicates no linear relationship between the variables, but there might still be a non-linear relationship.











Did you enjoy this article?