


Product Management Articles
How to Write a Product Requirements Document That Teams Actually Use
APIs for Product Managers: A Non-Technical Guide to API Basics, REST APIs, and Integrations
What Is Net Promoter Score? A Beginner’s Guide to NPS
Top Product Analytics Tools Compared: Amplitude vs Mixpanel vs Google Analytics


Get In Touch For Details! Request More Information
AARRR Framework: Key Product Metrics Every Product Manager Should Track
Aug 11, 2026 8 Min Read 182 Views
(Last Updated)
Table of contents
- TL;DR
- Introduction
- What Is the AARRR Framework?
- Why Should Product Managers Track AARRR Metrics?
- The Five Stages of the AARRR Framework
- Acquisition: Where Are Your Users Coming From?
- Activation: Are Users Experiencing Product Value?
- Retention: Are Users Coming Back?
- Referral: Are Users Bringing Other Users?
- Revenue: Is the Product Creating Business Value?
- Define One Meaningful Outcome for Each Stage
- Track the Funnel Between Stages
- Segment Your Product Metrics
- Use Cohort Analysis for Retention
- Turn Metrics Into Product Experiments
- Which AARRR Metric Should a Product Manager Prioritize?
- How Different Products Can Apply Pirate Metrics
- SaaS Product
- E-commerce Platform
- EdTech Platform
- Common Mistakes When Tracking AARRR Metrics
- Treating Acquisition as Product Success
- Defining Activation Too Loosely
- Tracking Too Many Product Metrics
- Looking at Averages Instead of Cohorts
- Tracking Metrics Without Acting on Them
- Build Data-Driven Product Management Skills
- Conclusion
- Frequently Asked Questions
- What is the AARRR Framework?
- Why is AARRR called pirate metrics?
- What are the five AARRR metrics?
- What is the difference between activation and acquisition?
- Which product metrics should a product manager track?
- How does the AARRR Framework help product managers?
- What is the most important metric in the AARRR Framework?
- Can AARRR be used for SaaS products?
- Is AARRR only useful for startups?
- What tools can be used to track AARRR metrics?
TL;DR
The AARRR Framework helps product managers measure the customer journey across five stages: Acquisition, Activation, Retention, Referral, and Revenue. Also known as pirate metrics, it gives product managers a simple way to identify where users enter a product, experience value, return, recommend it, and generate revenue. Instead of tracking dozens of disconnected product metrics, teams can use AARRR to focus product analytics on measurable outcomes. The framework is especially useful for startups, SaaS products, apps, and digital businesses looking to diagnose funnel problems and prioritize growth opportunities.
Introduction
Getting thousands of people to download an app sounds impressive. But what happens if most of them open it once and never return?
That is exactly why product managers cannot judge product performance using downloads, traffic, or sign-ups alone. You need to understand what happens throughout the user’s journey, from discovering the product to becoming a paying and potentially referring customer.
The AARRR Framework provides a simple way to do this.
Created by investor and entrepreneur Dave McClure and introduced in his 2007 “Startup Metrics for Pirates” presentation, the framework organizes growth into five stages: Acquisition, Activation, Retention, Referral, and Revenue.
These pirate metrics help product managers connect user behaviour with business outcomes and focus on the product metrics that reveal where growth is working and where the funnel is leaking.
Let us break down each stage and the metrics you should actually track.
What Is the AARRR Framework?
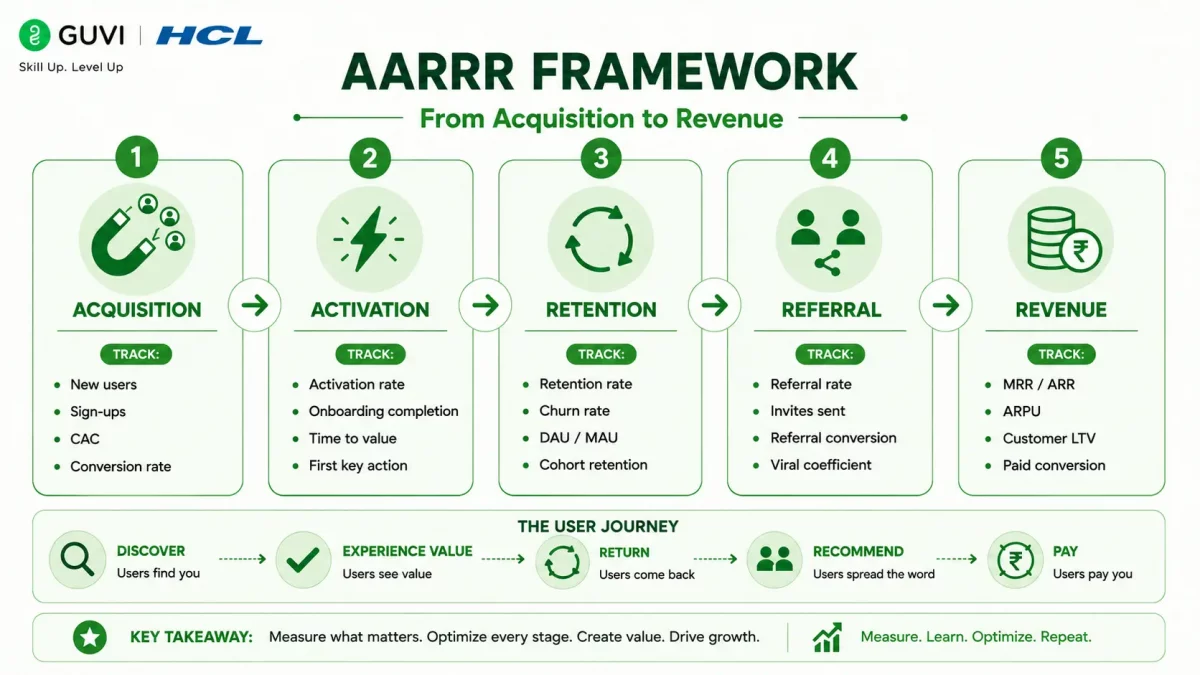
The AARRR Framework is a product and growth measurement model that divides the customer journey into five stages: Acquisition, Activation, Retention, Referral, and Revenue.
The framework is commonly called pirate metrics because saying its acronym aloud sounds like “Aarrr!”, stereotypically associated with pirates.
Rather than looking at isolated numbers, AARRR encourages teams to examine how users progress through a product funnel.
The five stages answer five fundamental questions:
- Acquisition: How do people find your product?
- Activation: Do they experience meaningful value?
- Retention: Do they keep coming back?
- Referral: Do they recommend the product to others?
- Revenue: Does user activity generate sustainable business value?
Together, these stages make acquisition, retention, revenue, and other growth signals easier to connect rather than measure separately.
The “pirate” name was not the original point of the framework. Dave McClure presented AARRR as a way to get startup founders to stop obsessing over superficial numbers and concentrate on five metrics that actually affected their businesses. The memorable pirate-like acronym helped the framework stick.
Why Should Product Managers Track AARRR Metrics?
A product can attract users and still fail. It can also have highly engaged users without generating enough revenue to remain sustainable.
This is why product managers need metrics that cover the complete customer journey.
The AARRR Framework helps you:
- identify where users drop out of the funnel;
- connect product behaviour with business performance;
- prioritize experiments based on measurable problems;
- compare user cohorts and acquisition channels;
- understand which experiences encourage retention;
- track growth without relying on vanity metrics; and
- create shared KPIs across product, marketing, growth, and revenue teams.
The importance of looking beyond acquisition becomes especially clear when you examine retention data. Pendo’s 2025 benchmark analysis reported that software products retained about 39% of users after one month and around 30% after three months. This means acquiring a user is only the beginning of the product journey.
Also explore : Product Manager Roadmap from Beginner to Industry-Ready

The Five Stages of the AARRR Framework
Each stage tells you something different about the health of your product. The exact metric you choose will depend on your business model, but the questions behind each stage remain largely the same.
Here is how the five stages work.
1. Acquisition: Where Are Your Users Coming From?
Acquisition measures how people discover and enter your product.
Users may arrive through organic search, paid advertising, social media, referrals, app stores, partnerships, email campaigns, or other channels.
Useful acquisition product metrics include:
- website visitors;
- app downloads;
- new sign-ups;
- customer acquisition cost (CAC);
- cost per acquisition (CPA);
- click-through rate (CTR);
- conversion rate by channel; and
- new users by acquisition source.
However, volume alone does not tell you which channel is valuable.
Imagine that paid ads generate 5,000 sign-ups while organic search generates only 2,000. Paid ads appear to be performing better.
But if organic users activate and retain at twice the rate of paid users, organic search may actually be the more valuable acquisition channel.
That is why acquisition data should always be connected with downstream metrics.
How to Calculate Customer Acquisition Cost
A basic CAC formula is:
CAC = Total Customer Acquisition Cost ÷ Number of New Customers Acquired
If a company spends ₹2,00,000 on acquisition activities and gains 1,000 new customers:
CAC = ₹2,00,000 ÷ 1,000 = ₹200 per customer
Product managers can then compare CAC with customer lifetime value and revenue to evaluate acquisition efficiency.
2. Activation: Are Users Experiencing Product Value?
Acquisition brings users through the door. Activation tells you if they actually experience the value your product promises.
An activation event is usually a meaningful action associated with the user’s first successful experience.
Depending on the product, this could mean:
- completing onboarding;
- creating the first project;
- sending the first message;
- uploading the first file;
- completing the first transaction;
- booking the first ride; or
- using a core feature successfully.
Useful activation metrics include:
- activation rate;
- onboarding completion rate;
- time to value;
- trial-to-active-user conversion;
- first key action completion; and
- onboarding drop-off rate.
For example, a project management platform should not necessarily define “account created” as activation. A stronger signal could be when the user creates a project, adds tasks, and invites a teammate.
The goal is to identify the moment when the user begins receiving genuine value.
Product benchmarking data reinforces this point. Pendo defines time to value as the time required for a new user to reach a meaningful core product event, with its best-in-class benchmark at 0.2 days across the applications in its dataset.
3. Retention: Are Users Coming Back?
Retention measures how many users continue using your product after their initial experience.
For many digital products, this is one of the most important signals of long-term product health.
Common retention metrics include:
- Day 1, Day 7, and Day 30 retention;
- monthly retention rate;
- churn rate;
- daily active users (DAU);
- weekly active users (WAU);
- monthly active users (MAU);
- DAU/MAU ratio;
- repeat purchase rate; and
- cohort retention.
Pendo describes retention analysis as a way to group users by shared characteristics or behaviours and to examine whether they continue to return to a product over time.
Suppose 1,000 people sign up for an app in January, but only 300 are still active three months later.
Instead of simply looking at total monthly users, a product manager can investigate that January cohort to understand when users dropped off and which behaviours separated retained users from churned users.
How to Calculate Retention Rate
A simple retention formula is:
Retention Rate = (Users Remaining at End of Period ÷ Users at Start of Period) × 100
If 800 users begin a period and 520 remain active:
Retention Rate = (520 ÷ 800) × 100 = 65%
The exact definition of “active” should match the product’s value. Logging in may be enough for one product but meaningless for another.
4. Referral: Are Users Bringing Other Users?
Referral measures how effectively existing users bring new people into the product.
Strong referral behaviour can indicate that users receive enough value from a product to recommend it voluntarily.
Useful referral metrics include:
- referral rate;
- referral conversion rate;
- number of invites sent;
- invite acceptance rate;
- viral coefficient;
- customer referral volume; and
- Net Promoter Score (NPS), when used as a supporting indicator.
For example, imagine a cloud collaboration tool that allows every user to invite teammates.
If users consistently invite three or four colleagues shortly after activation, those invitations can create an acquisition loop inside the product itself.
This is different from simply measuring customer satisfaction. A useful referral metric should ideally capture actual referral behaviour, not only stated willingness to recommend.
How to Calculate Referral Rate
A basic referral rate can be calculated as:
Referral Rate = (Customers Who Made a Referral ÷ Total Customers) × 100
If 200 out of 2,000 customers refer at least one new user:
Referral Rate = 10%
You can then measure how many referred users activate, retain, or become paying customers.
5. Revenue: Is the Product Creating Business Value?
Revenue is where product usage connects directly with financial outcomes.
A product may attract and retain users but still struggle if those users do not convert, upgrade, renew, or generate sufficient revenue.
Important revenue metrics include:
- monthly recurring revenue (MRR);
- annual recurring revenue (ARR);
- average revenue per user (ARPU);
- customer lifetime value (CLV or LTV);
- free-to-paid conversion rate;
- trial-to-paid conversion rate;
- expansion revenue;
- churned revenue; and
- LTV:CAC ratio.
Consider a SaaS platform offering Free, Pro, and Business plans.
A product manager could analyze which features free users interact with before upgrading. If users who collaborate with teammates are significantly more likely to purchase a paid plan, collaboration may become an important behaviour to encourage earlier in the user journey.
Revenue analysis therefore does more than tell you how much money the product makes. It can reveal which product behaviours contribute to monetization.
How to Use AARRR Metrics in Product Analytics
Knowing the metrics is only the first step. The real value comes from connecting them to user behaviour and product decisions.
Modern product analytics platforms allow teams to study funnels, user paths, cohorts, engagement, and retention. For example, Pendo’s analytics capabilities include paths, funnels, workflows, retention analysis, and product engagement measurement.
Define One Meaningful Outcome for Each Stage
Avoid starting with every metric your analytics platform can generate.
Instead, define a clear outcome for each stage.
For a SaaS collaboration tool, that might look like:
- Acquisition: account created;
- Activation: first workspace completed;
- Retention: user returns weekly;
- Referral: teammate invited; and
- Revenue: paid subscription started.
These definitions make dashboards easier to interpret.
Track the Funnel Between Stages
Next, measure how many users progress from one meaningful stage to another.
Suppose your funnel looks like this:
10,000 visitors → 2,500 sign-ups → 1,000 activated users → 600 retained users → 150 referrals → 300 paying users
The biggest raw drop occurs between visitors and sign-ups, but that does not automatically mean acquisition needs fixing.
You need to determine which drop-off creates the greatest constraint on sustainable growth.
Segment Your Product Metrics
Averages can hide important patterns.
Break AARRR metrics down by:
- acquisition channel;
- user persona;
- geography;
- device;
- subscription plan;
- company size;
- signup period; and
- feature usage.
You may discover, for example, that users acquired through referrals have lower volume but substantially higher retention.
That insight could change your growth priorities.
Use Cohort Analysis for Retention
Instead of comparing all users together, group users according to when they joined or what actions they performed.
You can then ask questions such as:
- Did users acquired in July retain better than users acquired in June?
- Do users who complete onboarding retain longer?
- Does using Feature A within the first week improve retention?
- Which acquisition channel produces the strongest 30-day retention?
Amplitude similarly treats retention as a core product performance category and notes that users who find value early are more likely to continue using a product.
Turn Metrics Into Product Experiments
Metrics should eventually lead to action.
If activation is weak, you could:
- simplify onboarding;
- reduce required form fields;
- surface the core feature sooner; or
- shorten time to first value.
If retention is weak, you could investigate:
- recurring user needs;
- feature adoption;
- usability friction;
- notification strategies; or
- gaps between user expectations and product experience.
This is where the AARRR Framework becomes a decision-making system rather than just a dashboard.
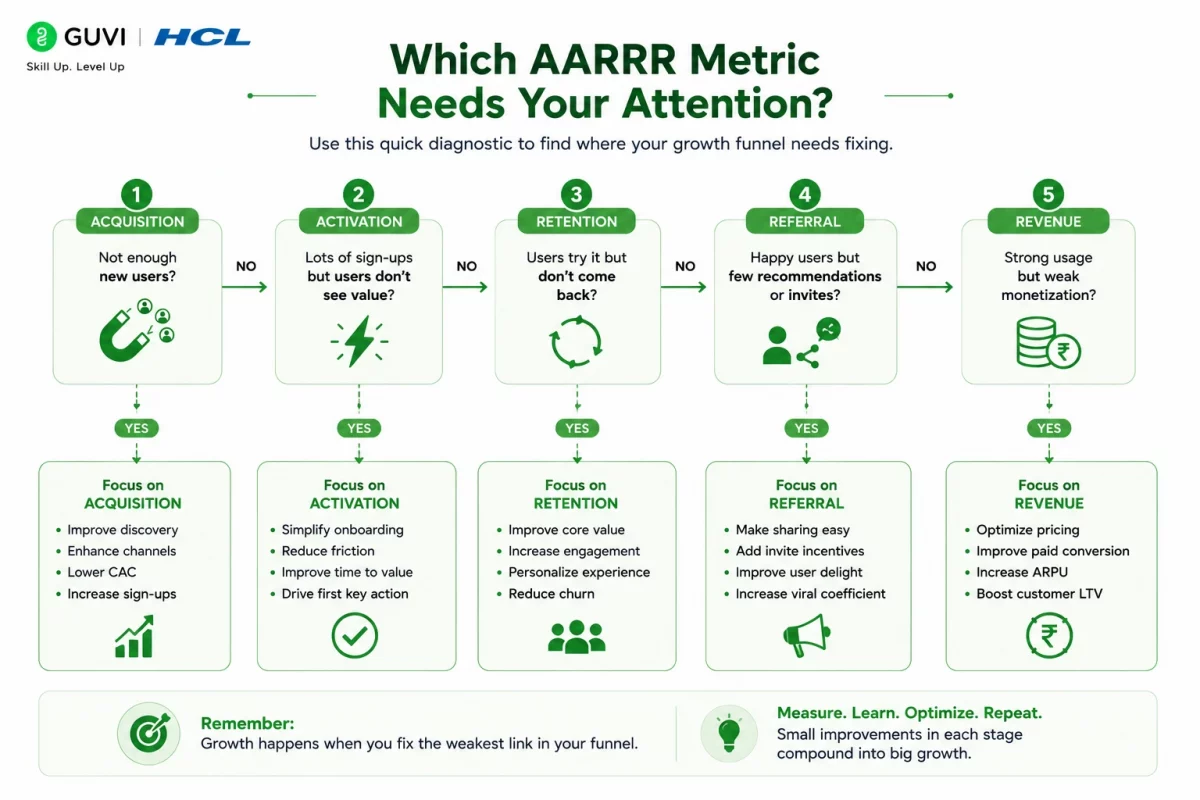
Which AARRR Metric Should a Product Manager Prioritize?
There is no single AARRR metric that every product manager should prioritize.
The right metric depends on the product’s biggest current constraint.
A new product struggling to attract users may focus on acquisition. A product with plenty of sign-ups but poor onboarding may prioritize activation. A mature subscription product could focus more heavily on retention and revenue.
A useful way to think about it is:
Find the weakest meaningful stage → investigate why users drop → run an experiment → measure the change.
This prevents teams from optimizing metrics simply because they are easy to measure.
How Different Products Can Apply Pirate Metrics
The same framework can look very different across industries. An activation event for an e-commerce platform, for instance, will not resemble activation for a B2B SaaS product.
Here are three examples.
SaaS Product
Consider a project management platform.
Its AARRR journey might be:
- Acquisition: User signs up after discovering the platform through search.
- Activation: User creates the first project and adds tasks.
- Retention: User returns several times each week.
- Referral: User invites teammates.
- Revenue: Workspace upgrades to a paid plan.
The product manager can then investigate which activation behaviours correlate most strongly with long-term retention.
E-commerce Platform
For an e-commerce product, the funnel could look like:
- Acquisition: Shopper arrives through search or advertising.
- Activation: Shopper views products, creates an account, or adds an item to the cart.
- Retention: Shopper returns or makes another purchase.
- Referral: Customer shares a referral code.
- Revenue: Customer completes purchases and increases lifetime value.
Here, repeat purchase rate can be especially useful for understanding retention.
EdTech Platform
An online learning platform could define the stages as:
- Acquisition: Learner discovers a course.
- Activation: Learner enrols and completes the first lesson.
- Retention: Learner continues completing lessons every week.
- Referral: Learner recommends the course to another learner.
- Revenue: Learner purchases a course, subscription, or advanced programme.
This example shows why “registration” is not necessarily activation. A learner who registers but never starts learning has not yet experienced the product’s core value.
Common Mistakes When Tracking AARRR Metrics
The AARRR Framework looks simple, but poor metric definitions can make even a sophisticated analytics dashboard misleading.
Here are some mistakes product managers should avoid.
1. Treating Acquisition as Product Success
A sudden jump in downloads, traffic, or registrations can make a product appear successful. However, acquisition tells you only that users reached the product, not that they found value.
Always connect acquisition with activation and retention. If a campaign brings thousands of new users who disappear after one session, optimizing that campaign further could simply increase the number of low-quality users entering the funnel.
The quality of acquired users matters as much as acquisition volume.
2. Defining Activation Too Loosely
One of the easiest mistakes is treating registration or login as activation.
Activation should represent the moment when a user receives meaningful product value. For a design platform, creating the first design may matter more than account creation. For a payment app, completing the first transaction could be the stronger event.
A weak activation definition makes the rest of your funnel less meaningful.
Spend time identifying the behaviour that genuinely signals early product value.
3. Tracking Too Many Product Metrics
Analytics platforms can generate hundreds of metrics, charts, and events. Tracking all of them does not necessarily make a team more data-driven.
Too many metrics can make it difficult to identify what deserves attention. Instead, define a small group of KPIs tied to important product outcomes and use supporting metrics when investigating changes.
Your dashboard should help you make decisions, not simply display everything that can be measured.
4. Looking at Averages Instead of Cohorts
Suppose overall retention stays at 40%. It may look stable.
But new users acquired through one campaign could have 20% retention while referral users have 65%. The overall average hides a major difference in user quality.
Cohort and segment analysis can expose these patterns.
Whenever a key metric moves, ask which users caused the change before deciding what action to take.
5. Tracking Metrics Without Acting on Them
A perfectly built dashboard has little value if nobody changes product decisions based on what it reveals.
Every important metric should lead to a question.
Why did activation decline? Which behaviour predicts retention? Why does one channel generate higher-value customers? What prevents trial users from upgrading?
The strongest product teams use product analytics to generate hypotheses, run experiments, and measure results instead of reporting numbers without context.
Build Data-Driven Product Management Skills
Understanding frameworks such as AARRR is useful because modern product managers are expected to connect customer behaviour, product strategy, growth, and business outcomes.
If you want to build these capabilities systematically, explore the Certificate Programme in Product Management by IIM Indore. The programme covers product lifecycle and strategy, market analysis, data-driven decision-making, go-to-market strategy, pricing, customer acquisition and retention, and AI applications in product management. It is particularly relevant for professionals who want to move beyond tracking metrics and learn how product insights translate into strategic decisions.
Also Read : The Future Scope of Management
Conclusion
The AARRR Framework gives product managers a practical way to understand the complete user journey instead of relying on isolated numbers. By tracking Acquisition, Activation, Retention, Referral, and Revenue, you can identify where users experience value, where they drop off, and which behaviours contribute to sustainable growth.
However, effective product analytics is not about collecting more data. It is about selecting meaningful product metrics and using them to make better decisions. Start with a few clearly defined pirate metrics, analyze user behaviour by cohorts and segments, and turn what you discover into measurable product experiments.
Frequently Asked Questions
1. What is the AARRR Framework?
The AARRR Framework is a growth measurement model covering five stages of the customer journey: Acquisition, Activation, Retention, Referral, and Revenue. Product teams use it to identify how users discover, experience, return to, recommend, and pay for a product.
2. Why is AARRR called pirate metrics?
AARRR is called pirate metrics because saying the acronym aloud resembles the stereotypical pirate expression “Aarrr!” The framework was popularized by Dave McClure through his “Startup Metrics for Pirates” presentation.
3. What are the five AARRR metrics?
The five categories are Acquisition, Activation, Retention, Referral, and Revenue. Each category can contain several individual metrics depending on the product and business model.
4. What is the difference between activation and acquisition?
Acquisition measures how users reach your product, while activation measures whether those users experience meaningful initial value. A signup can represent acquisition, while successfully completing a core product action may represent activation.
5. Which product metrics should a product manager track?
Useful product metrics include activation rate, retention rate, churn, DAU/MAU, CAC, customer lifetime value, referral rate, MRR, ARR, and conversion rate. The right metrics depend on the product’s business model and current growth priorities.
6. How does the AARRR Framework help product managers?
The framework helps product managers organize product analytics around the user journey. It makes it easier to identify funnel bottlenecks, prioritize experiments, compare cohorts, and connect product behaviour with growth and revenue.
7. What is the most important metric in the AARRR Framework?
There is no universally most important AARRR metric. The priority should depend on the biggest constraint in your product funnel, such as weak activation, poor retention, low referrals, or ineffective monetization.
8. Can AARRR be used for SaaS products?
Yes. SaaS companies can use AARRR to measure acquisition channels, onboarding and activation, subscription retention, referrals, MRR, ARR, upgrades, and other recurring revenue metrics.
9. Is AARRR only useful for startups?
No. Although the framework originated in the startup ecosystem, its stages can be applied to established digital products, SaaS platforms, e-commerce businesses, apps, EdTech products, and other businesses with measurable customer journeys.
10. What tools can be used to track AARRR metrics?
Product teams can use analytics platforms such as Amplitude, Mixpanel, Pendo, or their own BI and analytics systems. The tool matters less than defining meaningful events, reliable data, and clear metrics for each AARRR stage.
Success Stories














Did you enjoy this article?