


Artificial Intelligence and Machine Learning Articles
Who is an ML Engineer? A Complete Guide
Who Is an AI Engineer? Role, Skills & Career Path
Matrix Chain Multiplication: A Complete Guide
What is Dijkstra's Algorithm: A Complete Guide to Shortest Path


Get In Touch For Details! Request More Information
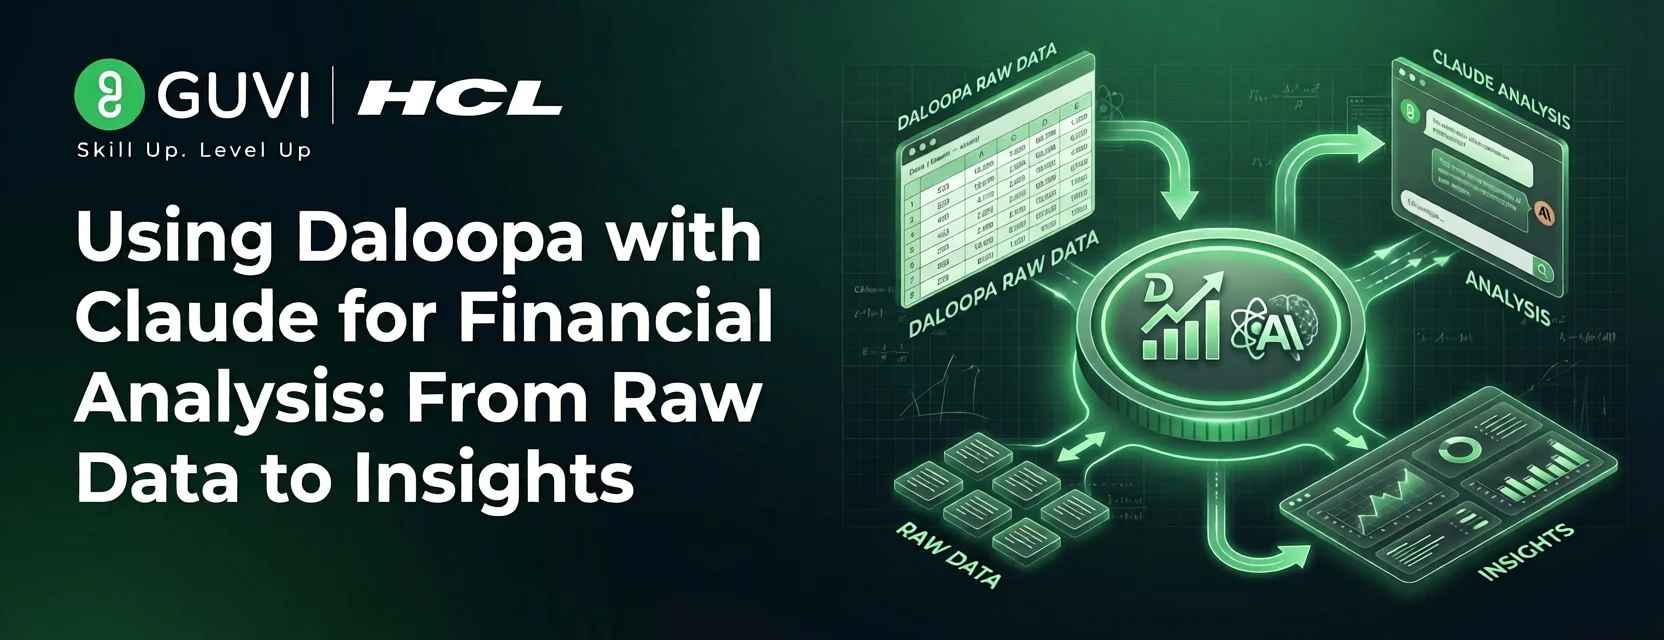
Using Daloopa with Claude for Financial Analysis: From Raw Data to Insights
Apr 20, 2026 6 Min Read 706 Views
(Last Updated)
Financial analysis is historically a time-consuming process, where analysts manually pull financial information from financial reports, spreadsheets, and filings. This can slow down the decision-making process, increase the probability of errors and discrepancies.
Tools like Daloopa and AI like Claude are transforming the process by offering automation in both extracting information and analyzing that data. Daloopa allows for the automatic extraction of structured financial data from challenging documents, whereas Claude analyzes the extracted data and generates new insights.
In this article, you will discover how you can use Daloopa in your financial analysis workflows with Claude, ranging from setup and data extraction to relevant real-world examples and guidelines.
TL;DR
- Daloopa financial analysis uses AI-powered data pipelines to automatically extract structured financial data from reports, filings, and other documents.
- Claude enriches financial workflows by allowing analysts to analyze financial data, discover trends, and generate insights through natural language prompts.
- Together, Daloopa and Claude drastically reduce manual work, improve accuracy, and speed up tasks involved in financial modeling and research.
- This includes understanding how to get started, exploring real-world use cases, applying best practices, and avoiding common mistakes when using both tools.
Table of contents
- What is Daloopa and Why It Matters for Financial Analysis
- How Daloopa Simplifies Financial Data Extraction
- Why This Matters for Modern Financial Workflows
- How Claude Improves Financial Analysis Workflows
- From Data to Insights Using Natural Language
- Using Python for Supporting Calculations
- Supporting Financial Modeling and Interpretation
- Improving Speed Without Losing Context
- Why Combine Daloopa with Claude
- Data Quality Meets AI
- Improved Decision-Making Without the Tedious Work
- Setting Up Daloopa with Claude
- Prerequisites
- Connecting Data from Daloopa to Claude
- Simple Integration Setup
- Keeping the Integration Streamlined and Effective
- Real-World Use Cases in Finance
- Best Practices for Accurate AI-Based Financial Analysis
- Common Mistakes to Avoid
- Conclusion
- FAQs
- What is Daloopa used for in financial analysis?
- How does Claude help in financial workflows?
- Do I need programming knowledge to use these tools?
- Can Daloopa and Claude replace financial analysts?
- Is this workflow suitable for beginners?
- How accurate is AI-based financial analysis?
What is Daloopa and Why It Matters for Financial Analysis
Daloopa is a financial data automation platform that extracts structured data from financial reports, investor presentations, earnings reports, and filings. Instead of manually pulling data from documents or spreadsheets, the platform converts unstructured financial data into clean, structured datasets ready for analysis.
This directly impacts financial analysis because the traditional workflow requires time before the analytical process. Financial analysts spend hours per week pulling data before they can even start to generate insights. Daloopa overcomes this hurdle by providing clean, structured data at the outset and allowing analysts to expedite evaluation, modeling, and decision-making.
How Daloopa Simplifies Financial Data Extraction
Financial documents vary widely in format, which can make manually extracting data very slow and prone to errors. Daloopa solves this problem by standardizing this process by recognizing the primary financial items, revenue, EBITDA, margin, etc., and arranging them into formats that are easily usable.
This leads to a decreased reliance on manual data entry and results in data that is easily comparable between various companies and over periods.
Why This Matters for Modern Financial Workflows
In the real world, the impact of analysis relies heavily on the quality of data being analyzed. Inconsistent and unreliable data inputs can lead to inaccurate outputs.
Automated extraction and standardization by Daloopa not only speeds up analysis by increasing the accuracy and reliability of financial data, but also allows financial analysts to spend less time on data collection and analysis of financial items and more time focusing on modeling, forecasting, and strategy.
This also reflects the growing importance of data-driven approaches in finance, where structured data directly impacts insights. To understand this foundation better, you can explore this guide on data science.
Financial analysts can spend up to 60–70% of their time collecting and cleaning data instead of analyzing it. With tools like Daloopa handling structured data extraction and Claude enabling instant analysis through natural language, workflows are shifting toward insight-driven decision making rather than manual preparation.
How Claude Improves Financial Analysis Workflows
Claude helps optimize financial analysis by shifting focus from human interpretation to AI-driven interpretation. When Daloopa is used to produce reliable and structured financial data, Claude can take this input and quickly interpret patterns, identify trends, and generate analysis in the form of natural language text, rather than having the analyst work through many separate worksheets.
Working with financial statements becomes much less like sifting through spreadsheets; analysts can use natural language to explore data, prove or disprove assumptions, and generate analysis instead of using complex spreadsheet formulas.
From Data to Insights Using Natural Language
The most potent feature of Claude in the context of financial data analysis is the ability to question data. Instead of using calculations or tools, the analyst can simply pose a question and receive a structured analysis of their data.
An example could be:
“Review this quarter’s revenues and highlight any anomalies and growth patterns.”
Here, Claude can take the data as an input, identify trends in growth or data anomalies, and even suggest underlying factors for trends. This shortens the time spent doing an initial round of analysis and helps to quickly form hypotheses about data trends.
Curious how tools like Claude go beyond basic prompts and actually power real-world AI workflows? The Generative AI Ebook dives into practical use cases, smart prompting techniques, and how AI is applied across industries.

Using Python for Supporting Calculations
Simple computations are often handled using Python before passing results to AI systems. If you want to understand the basics, you can start with this guide on getting started with Python
revenue = [120, 135, 150, 170]
growth = [(revenue[i] – revenue[i-1]) / revenue[i-1]
for i in range(1, len(revenue))]
print(“Growth Rates:”, growth)
The typical use of these operations will be on backend processes or in the analysis environment, where Claude is called to analyze the output from the processing.
The workflow can thus become a complete end-to-end process where the input is the structured data input to Daloopa, Python for data processing, Claude for data analysis, and then the frontend presentation of results to the analyst.
Supporting Financial Modeling and Interpretation
There are additional ways in which Claude may supplement financial modeling tasks. Though Claude is not capable of building detailed financial models, it is useful in the following areas:
- Explaining correlations between variables
- Providing an explanation of financial statements
- Suggesting variables or assumptions for use in forecasting models
Given some input revenue and cost data, for example, Claude can help an analyst understand changes in profit margins or the areas where operational efficiency may be declining.
Improving Speed Without Losing Context
The speed is probably the most dramatic way in which Claude improves the financial workflow. While the same types of reports take hours for an analyst to summarize, spot trends, and benchmark, an analyst can achieve the same with Claude in minutes.
However, it does so while maintaining context: analyzing how all the data relate to each other in the prompt, rather than analyzing data points in a vacuum, which is especially important when dealing with multiple financial variables.
Why Combine Daloopa with Claude
Using Daloopa or Claude on their own improves different aspects of the financial workflow, but together they form a comprehensive system. Daloopa takes care of the data structuring and organization layer, while Claude is responsible for the analytical work and insight generation.
Together, they lower the overall level of manual work, as well as cognitive load across the entire workflow. This way, analysts no longer need to switch between different tools or clean and format data before starting analysis.
Data Quality Meets AI
Daloopa ensures that data extracted from financial documents is structured and standardized, reducing inconsistencies that typically arise from manual extraction.
Faster End-to-End Financial Workflow
Usually, analysts would spend most of their time on extracting and cleaning data, and only then would they start analyzing it. Using Daloopa for extraction and Claude for interpretation makes this quicker:
Traditionally:
- Manually extract the relevant financial metrics
- Clean and structure the data
- Analyze trends
Now:
- Use structured data from Daloopa
- Analyze trends using Claude
Improved Decision-Making Without the Tedious Work
The integrated workflow helps streamline the process and remove much of the manual labor involved in analysis. This allows analysts to spend less time crunching numbers and more time comparing alternatives, refining hypotheses, and justifying conclusions.
This more focused analysis leads to better-informed decisions due to increased time spent analyzing instead of manipulating data.
Setting Up Daloopa with Claude
Integrating Daloopa and Claude requires ensuring that the financial data extracted by Daloopa is easily interpretable by Claude. The setup is not based on extensive API integration; it focuses on enabling an easy transition between data extraction and analysis.
The core workflow is comprised of extracting financial data using Daloopa and inputting that data into Claude for analysis by simply asking the AI.
Prerequisites
Before beginning, confirm access to the following:
- Daloopa account with access to the required financial data
- Access to Claude with the ability to input and analyze structured financial data
- General knowledge of financial analysis, such as revenue, cost, and margin
Without accessible financial data within Claude, the accuracy of results is limited; ensuring the Daloopa portion is correctly set up is crucial.
Connecting Data from Daloopa to Claude
There isn’t a predefined, set-in-stone integration that needs to be set up between the two systems. The actual connection is done through a transfer of data.
Simple Integration Setup
- Get the financial data from Daloopa in a clean, structured format, such as tables or a CSV file
- Paste or upload the data into Claude
- Use prompts to allow Claude to analyze, summarize, or provide a diagnosis of the data
For example, one could pull quarterly revenue numbers out of Daloopa and input that into Claude, asking:
“Analyze this data, and highlight any trends and potential issues in revenue growth over the specified time period.”
Claude will then analyze the data based on the instructions provided.
Keeping the Integration Streamlined and Effective
One should always provide data in a clear, readable format for optimal input into Claude. Avoid:
- Incomplete data
- Ambiguous labels
- Missing context, such as a timeframe
This allows Claude to analyze the data effectively.
Real-World Use Cases in Finance
- Company comparison
Analysts compare different companies based on metrics like revenue, margins, and growth to highlight differences between firms. - Trend analysis
Comparing data over various quarters or years shows trends, seasonality, and potential anomalies. - Performance evaluation based on critical business metrics
There are other figures besides financial ones to focus on, such as product performance and operational efficiency, which can indicate deeper business performance. - Earnings analysis
Post earnings, company data is compared to earlier periods to identify what changed and why financial results differ. - Industry or company exploration
When working with new companies or industries, analysts study available data to determine which metrics are most relevant for evaluation.
These use cases are part of a broader shift where AI is actively transforming financial workflows and operations. You can explore how AI tools and plugins are used in finance here:
Best Practices for Accurate AI-Based Financial Analysis
- Clean and structured input data
The better-structured the input data, the better the AI results. Messy or incomplete data results in flawed insights. - Validate AI insights
Crucial AI outputs, especially for financial decisions, should always be cross-checked. AI augments analysis; it does not supersede decision-making. - Contextualize AI prompts
Including information such as the time frame, company, or metric involved in the analysis generates more precise and appropriate outputs. - Prioritize critical financial metrics
Analysis using excessive inputs will result in unfocused outputs. Limit analysis to the most essential financial metrics for clarity and decision-making. - Pair AI with basic calculations
Utilizing fundamental computation through tools such as Python in conjunction with AI enhances analysis accuracy and validation. - Avoid over-reliance on automation
AI increases the speed of workflow, but domain expertise and critical thinking remain necessary for correct financial analysis.
Common Mistakes to Avoid
- Trusting AI blindly
AI outputs must be verified and not simply taken as definitive answers for financial analysis. - Using poorly formatted or missing data
Errors in input data, whether poorly formatted or incomplete, directly affect AI analysis results. - Not giving enough context in prompts
Generic or broad prompts result in generalized and unhelpful AI-driven outputs. - Neglecting context and time period
When interpreting financial data, it is critical to understand what it represents and the time frame being used. - Overwhelming analysis with numerous metrics
If too many metrics are included in a single analysis, outputs become difficult to interpret. - Not fact-checking critical financial data
All key figures used in the analysis should be verified using appropriate tools or calculations.
Conclusion
Financial analysis is no longer manually processed through spreadsheets but is transitioning toward structured workflows utilizing automation and AI. Tools such as Daloopa and Claude assist this process through the integration of data extraction and analysis.
Integrating structure, elementary computation, and AI assistance allows analysts to shorten the time it takes to turn raw data into reasonable conclusions and minimize manual work.
To effectively work with AI-driven financial analysis workflows, having a strong understanding of data handling, machine learning concepts, and how AI models interpret financial data is essential. If you’re looking to build these skills in a practical, structured way, programs like the HCL GUVI AI and Machine Learning Course can help you gain hands-on experience in working with real-world data and building intelligent analytical systems.
FAQs
1. What is Daloopa used for in financial analysis?
Daloopa is used to extract and structure financial data from reports, filings, and other sources, making it easier to analyze without manual data collection.
2. How does Claude help in financial workflows?
Claude helps analyze structured data, identify trends, and generate insights using natural language prompts, reducing the need for manual interpretation.
3. Do I need programming knowledge to use these tools?
Basic understanding of programming, especially Python, can be helpful for data processing and validation, but it is not always mandatory.
4. Can Daloopa and Claude replace financial analysts?
No, they assist analysts by speeding up workflows and improving efficiency, but human judgment is still essential for decision-making.
5. Is this workflow suitable for beginners?
Yes, beginners can start with simple use cases and gradually learn to work with structured data and AI-based analysis.
6. How accurate is AI-based financial analysis?
AI can provide fast and useful insights, but its accuracy depends heavily on the quality of input data and the clarity of prompts. While tools like Claude can identify patterns and trends effectively, results should always be verified before making financial decisions.
Success Stories

About the Author
Vishalini Devarajan
An Aerospace Engineer turned content writer, I focus on making complex concepts easy to understand through well-structured, reader-friendly blogs. Whether it’s a technical topic or a non-technical one, I love creating content that is clear, engaging, and impactful.
View all posts by Vishalini Devarajan
Connect with me @


Did you enjoy this article?