


Hypothesis Testing and A/B Testing
Hypothesis Testing and A/B Testing
Hypothesis testing helps you decide if a pattern in your data is real or just chance. It is the base of many business experiments.
a. Understanding Hypothesis Testing
A hypothesis test is a method to check a claim using data. You start with a null hypothesis, which says there is no effect or no difference. The alternative hypothesis says there is one.
For example, the null hypothesis might say that a new website design has no effect on sales. You collect data and test whether the results are strong enough to reject that idea.
You also choose a significance level before the test, usually 0.05. This is the amount of risk you accept of finding an effect that is not really there.
b. T-Tests and Chi-Square Tests
A t-test compares the averages of two groups. For example, you can check if customers who saw a new offer spent more than those who did not. SciPy provides this in a single function.
from scipy import stats
t_stat, p_value = stats.ttest_ind(group_a, group_b)
print(p_value)
A chi-square test checks if two categorical columns are related. For example, it can test if the preferred product differs by city.
table = pd.crosstab(df["city"], df["product"])
chi2, p, dof, expected = stats.chi2_contingency(table)
print(p)
Choose the test that matches your data. Use a t-test for comparing numeric averages and a chi-square test for comparing categories.
c. Understanding P-Values and Significance
The p-value tells you how likely you are to see results at least this strong if the null hypothesis were true. A small p-value means the results are unlikely to be due to chance.
If the p-value is below your significance level, such as 0.05, you reject the null hypothesis and call the result statistically significant. If it is above, you do not have enough evidence to claim a difference.
A p-value does not tell you how big or important an effect is. A tiny difference can be significant in a very large sample. Always look at the size of the effect as well as the p-value.
d. Running and Interpreting an A/B Test
An A/B test compares two versions of something, like two webpage designs. Users are randomly split into group A, which sees the original, and group B, which sees the new version. You then compare a metric such as the conversion rate.
Plan the test before you start. Decide the metric, the significance level, and how many users you need. Do not stop the test early just because the results look good, as this raises the risk of false results.
After the test, use the right statistical test and check the p-value. Report the result in plain words, such as "Version B increased sign-ups by 12 percent, and the result is statistically significant." Also share the size of the change and any limits of the test.
Data Analysis with Python Handbook
Wesline Rinisha

Recommended Handbooks

C++ Handbook

Python Basics Handbook

Javascript Handbook

Building a Random Joke Generator Using ReactJS
Build a Character Counter in React JS

Build Your QR Code Generator using React JS

Build a Birthday Reminder App using React JS

Building BMI Calculator Using ReactJS
Building Random Password Generator using ReactJS
Temperature Converter Project in React
Building a To-Do List App Using ReactJS
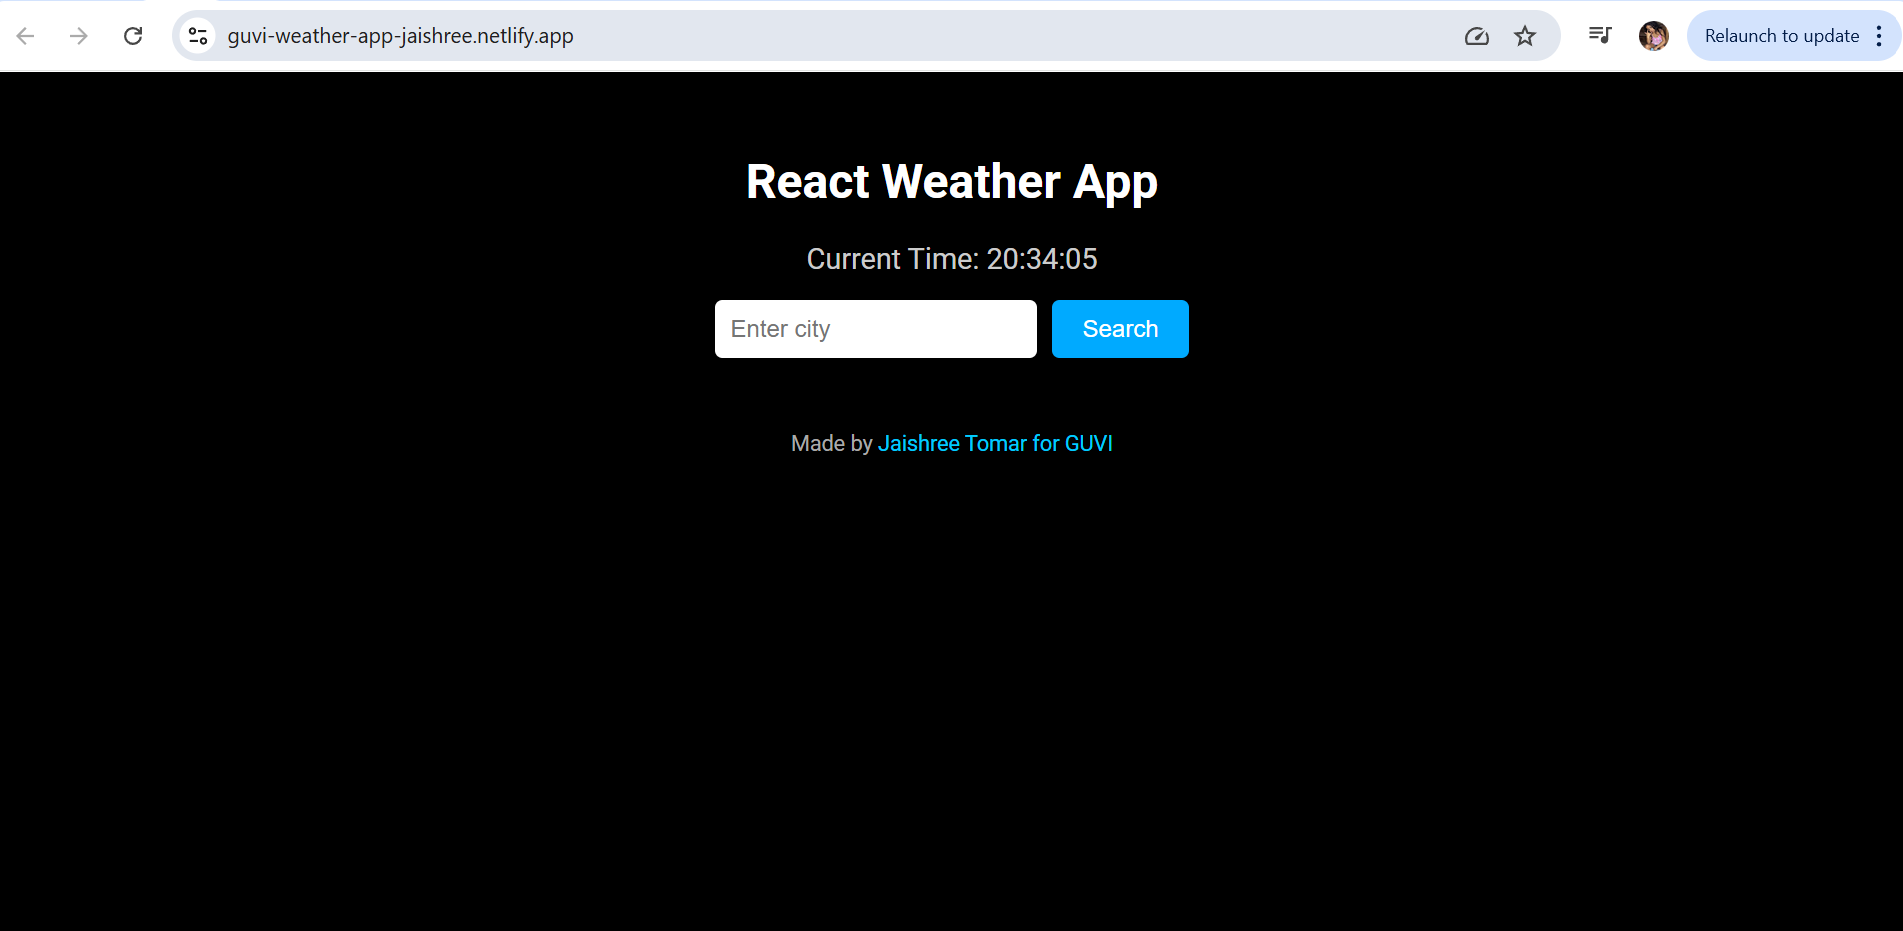
Building a Weather App Project Using ReactJS
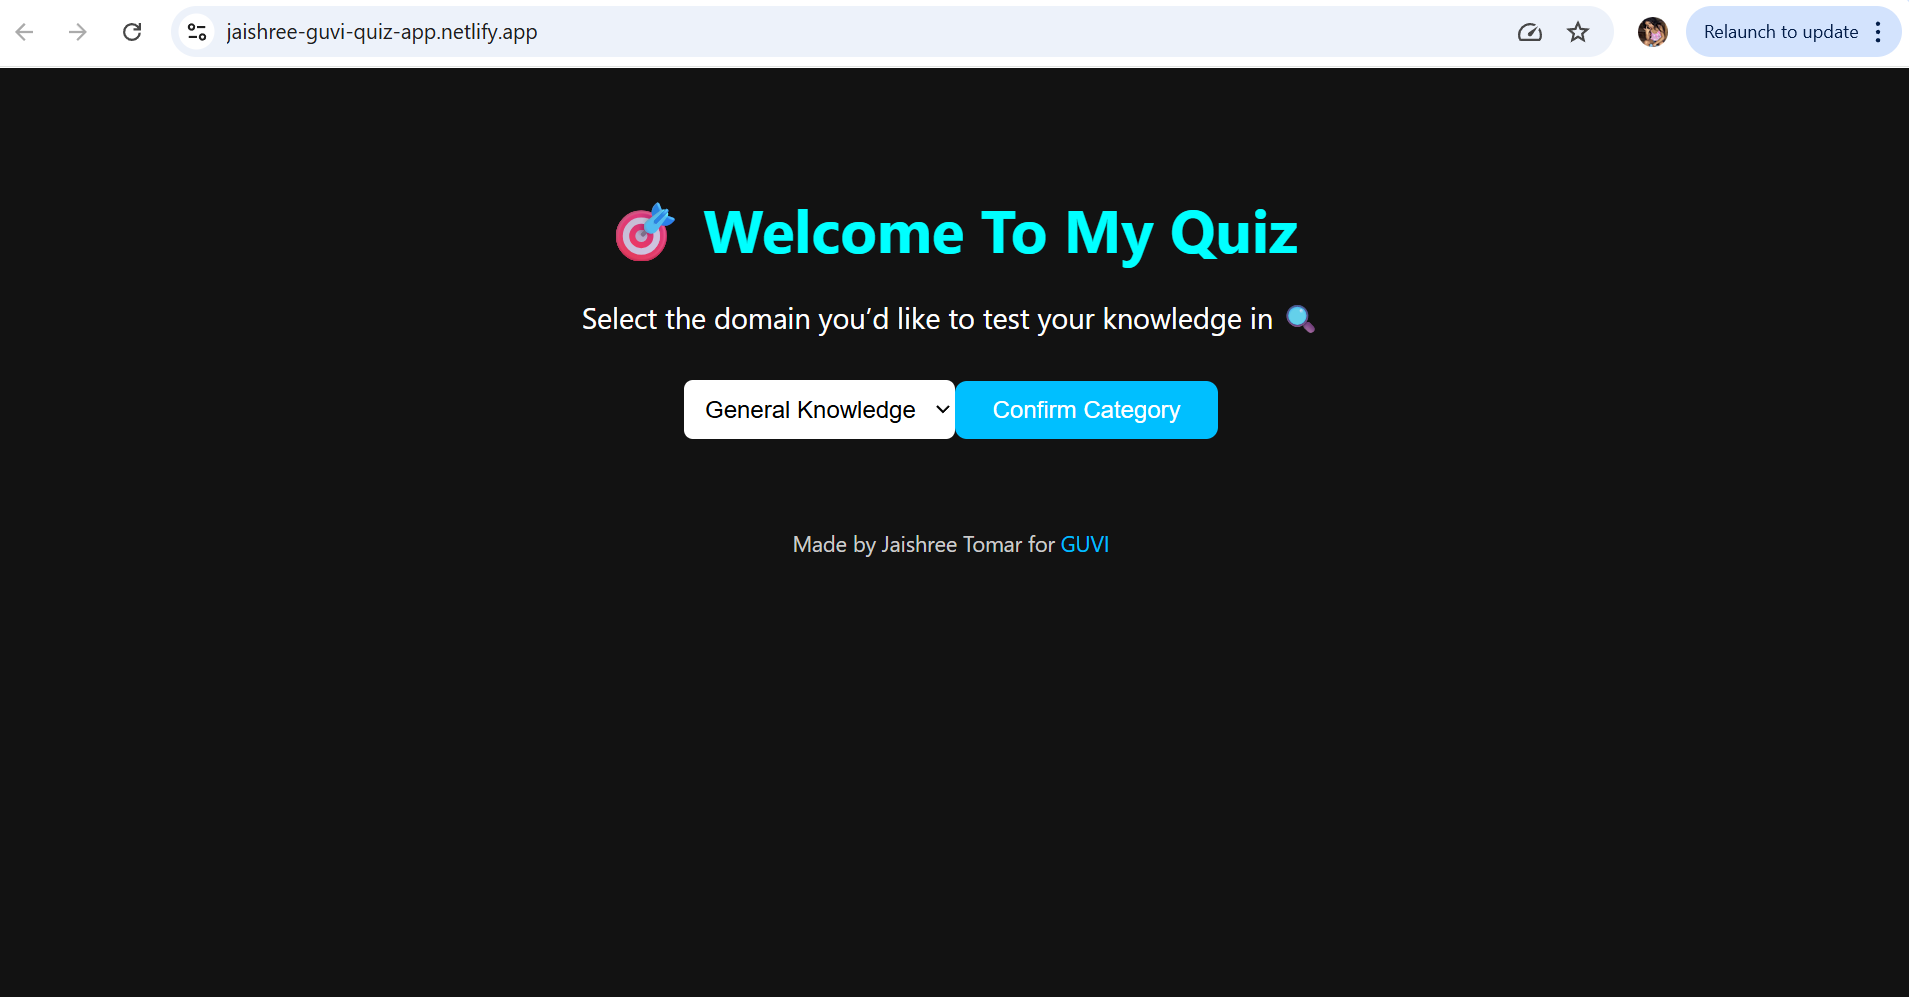
Building a Quiz App in ReactJS
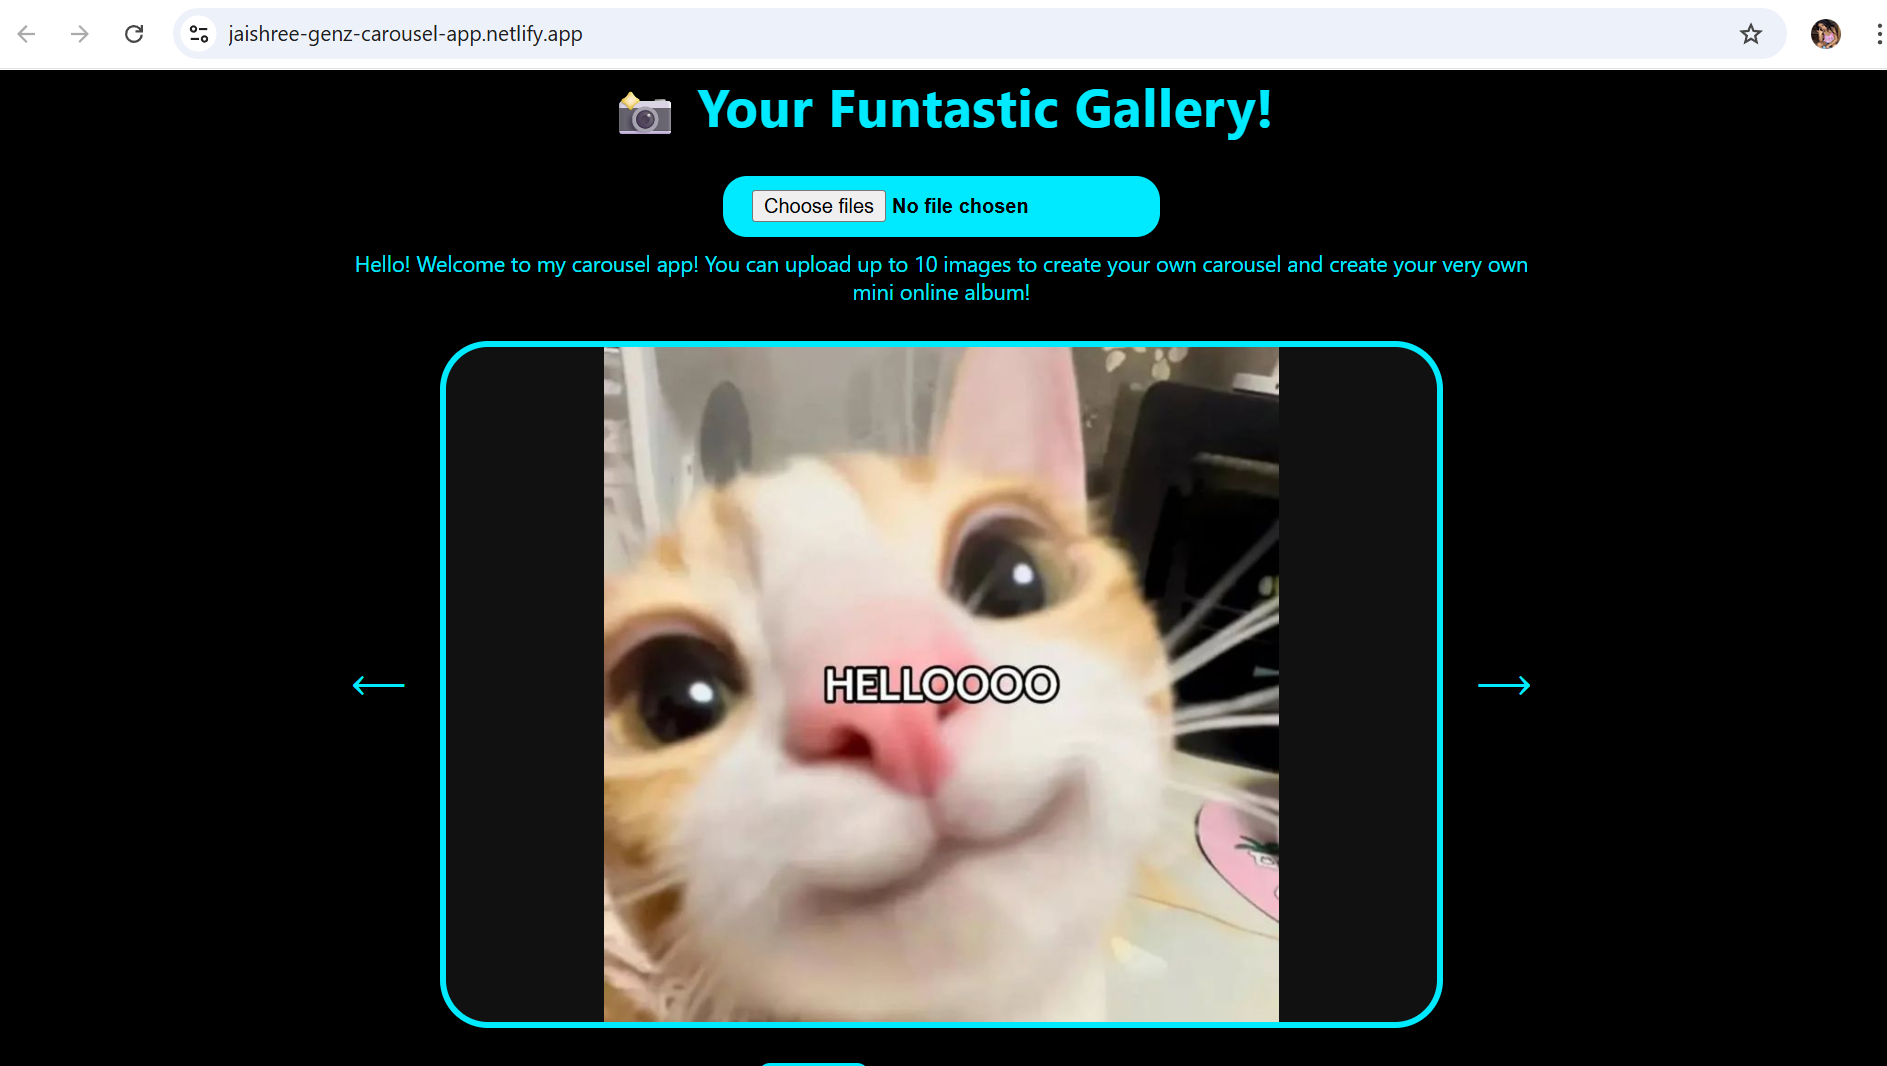
Building a GenZ Carousel App in React

ReactJS Projects Handbook

Computer Networks Tutorial

Operating System Tutorial
DBMS and SQL Tutorial

Java Tutorial

C Language Tutorial

PHP Tutorial

Android Tutorial

Linux Guide Tutorial
Data Structures and Algorithms Tutorial

Computer Architecture

HTML 5 References Tutorial

Docker Tutorial
GIT (Using Github) Tutorial

Go Language Tutorial

GIT Guide

CSS Tutorial
Advanced Data Structures

Spring Framework Tutorial

Spring Boot Tutorial

Kotlin Tutorial

Apache Cordova Tutorial

Python Tutorial

SASS-SCSS Tutorial

MongoDB Tutorial

Numpy Tutorial
PL-SQL Tutorial
Python Built-in Functions Tutorial

Pandas Tutorial

Elasticsearch Tutorial

Matplotlib Tutorial

Web Scraping Tutorial

Networking with Python

Tkinter Tutorial
Java Programs Tutorial
Java Examples Tutorial

Servlet Tutorial

JSP Tutorial
Java Type Conversion Tutorial
Java 8 Tutorial
Java 9 Tutorial
Java 10 Tutorial

Java 11 Tutorial
Java Util Library Tutorial
Building a Contact Us Form in ReactJS

Building a Age Calculator App Using ReactJS

Movie Recommendation System Project Using Content-Based Filtering
Recipe Finder App using ReactJS

Sales Data Analysis Project for Beginners Using Data Science
Student Performance Analysis Project for Beginners Using Data Science

Word Counter Tool Using ReactJS

Customer Churn Prediction Project Using Classification Techniques

Basic Expense Tracker App using ReactJS
Simple Binary to Decimal Converter in React

Real-Time Unit Converter in React

House Price Prediction Using Machine Learning (XGBoost)
Weather Data Analysis and Visualization Using Python

Expandable Accordion Component using React

OTP Verification Component using React
Cricket Data Analysis Using Python

Credit Card Fraud Detection for Beginners using Data Science

Deep learning Tutorial

Software Development Life Cycle Tutorial

Stock Price Prediction for Beginners using Data Science

Apache Kafka Tutorial

Angular Tutorial

Django Tutorial

Computer Programming Tutorial

Tensorflow Tutorial

Java OOPs Concepts Tutorial

Building an Image Classification System Using CNN

News Recommendation System Using Machine Learning

Fake Review Detection System using Machine Learning

Product Feedback App Using Full Stack Development - Customer Review and Rating System

Job Portal with Applicant Tracking System Using Full Stack Development

(FalCon Store) A Modern React-Based E-Commerce App UI with Admin Dashboard

Student Management System using Python (Beginner-Friendly Project Guide)

HTML Tutorial - From Basics to Implementation

Machine Learning Tutorial

ReactJS Tutorial

Hibernate Tutorial
Probability and Statistics for Data Science

Artificial Intelligence Tutorial

Power BI Tutorial

R for Data Science
SQL for Data Science