Memory Leaks in Java Applications: Identify & Resolve
Mar 11, 2026 2 Min Read 1372 Views
(Last Updated)
Memory leaks are notorious silent killers in Java applications. Even with Java’s garbage collector doing the heavy lifting, improper code practices can lead to memory leaks, degrade application performance, or cause crashes over time.
In this blog, we’ll explore what memory leaks are, how to identify them, and most importantly, how to resolve and prevent them.
Table of contents
- What is a Memory Leak?
- Common Causes of Memory Leaks
- Static Collections
- Unclosed Resources
- Inner Classes with Outer Class References
- Listeners and Callbacks
- ThreadLocal Misuse
- Identifying Memory Leaks
- 1. Using Heap Dumps
- Monitoring GC Activity
- JConsole & Java Mission Control
- How to Fix and Prevent Memory Leaks
- Remove Unused Object References
- Use Weak References
- 3. Close Resources Properly
- Detach Listeners
- 5. Avoid Long-Lived Static Fields
- Real-World Case
- Final Thoughts
What is a Memory Leak?

In Java, a memory leak occurs when objects that are no longer needed are still referenced, making them ineligible for garbage collection. As a result, these objects continue to occupy heap memory, gradually consuming all available memory, which can eventually lead to an OutOfMemoryError.
Despite Java’s automatic memory management, developers must be vigilant to avoid unintentional strong references that cause memory leaks
Common Causes of Memory Leaks

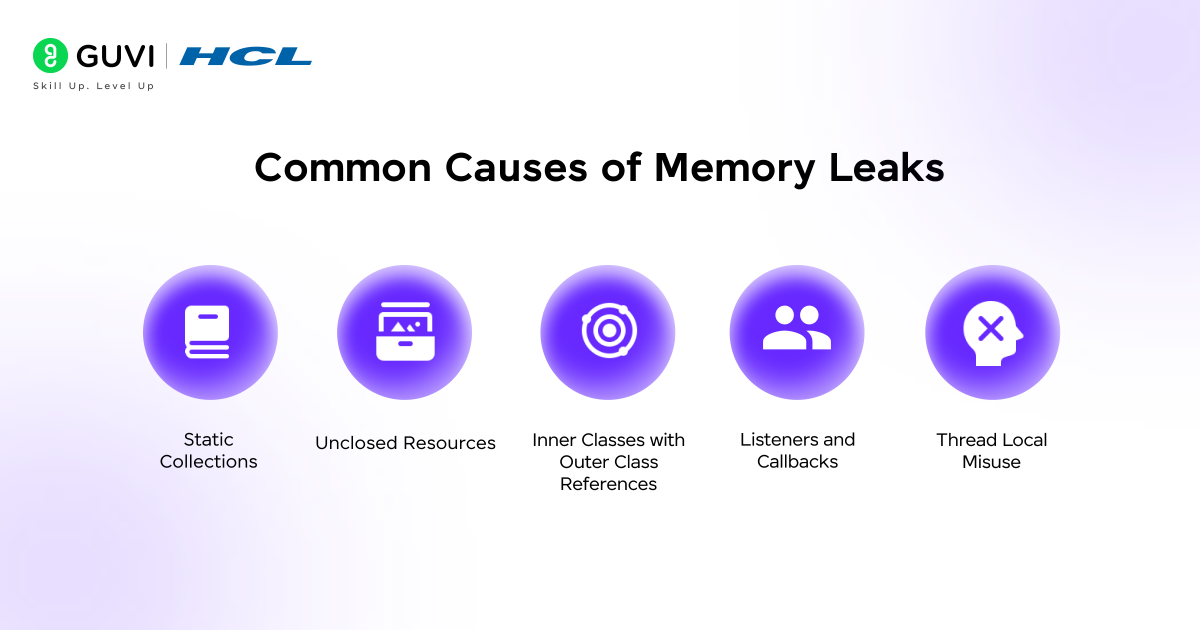
1. Static Collections
Static maps or lists can retain references to objects beyond their lifecycle.
private static List<User> users = new ArrayList<>();
If not cleared, these objects stay alive throughout the application’s lifetime.
2. Unclosed Resources
Failing to close file streams, DB connections, or sockets results in memory/resource leaks.
3. Inner Classes with Outer Class References
Anonymous or non-static inner classes hold implicit references to outer class instances, preventing garbage collection.
4. Listeners and Callbacks
Not removing event listeners (like GUI or custom observers) can create memory leaks.
5. ThreadLocal Misuse
Not removing ThreadLocal variables in thread pools may cause memory leaks due to reused threads.
Identifying Memory Leaks
1. Using Heap Dumps
Tools like:
- VisualVM
- Eclipse MAT (Memory Analyzer Tool)
- JProfiler
These allow you to analyze heap dumps and track memory-retaining objects.
2. Monitoring GC Activity
Use JVM flags:
-verbose:gc
-XX:+PrintGCDetails
Excessive GC with increasing memory usage indicates possible leaks.
3. JConsole & Java Mission Control
Java provides built-in profiling tools to track memory usage in real time.
How to Fix and Prevent Memory Leaks

1. Remove Unused Object References
Set unused objects to null if they’re not needed anymore, especially in large collections.
2. Use Weak References
Use WeakHashMap or WeakReference when you want the object to be garbage collected when no longer referenced.
3. Close Resources Properly
Use try-with-resources:
try (BufferedReader br = new BufferedReader(new FileReader("file.txt"))) {
    // logic
}
4. Detach Listeners
Always deregister event listeners when objects are destroyed.
5. Avoid Long-Lived Static Fields
Avoid using static collections unless necessary, and always clear them after use.
Real-World Case
Problem: A Java web app using a static cache (Map) to store user sessions led to memory buildup.
Solution: Replaced with WeakHashMap and implemented session expiration using a scheduled cleaner.
Outcome: 45% memory usage drop and no more OutOfMemoryErrors.
Begin your career journey with HCL GUVI’s Java Full Stack Development Course, providing placement assistance. Master essential technologies including Java, Maven, Eclipse, HTML, CSS, MongoDB, and more while working on practical, real-world projects to enhance your expertise.
Final Thoughts
Memory leaks in Java are subtle yet impactful. Proactively using profiling tools, writing mindful code, and following best practices can help prevent them. Remember: the garbage collector isn’t magic — it only works when you let go of object references correctly.


Did you enjoy this article?