


Business Analytics Articles
Python for Business Analysts: Where to Start Without a CS Background
Data Visualization in Business Analytics: Choosing the Right Chart for Business Decisions
Data Integration in Business Analytics: Methods, Tools and Best Practices
Is Business Analyst a Good Career? An Honest Look at the Pros, Cons, and Who Should Skip It


Get In Touch For Details! Request More Information
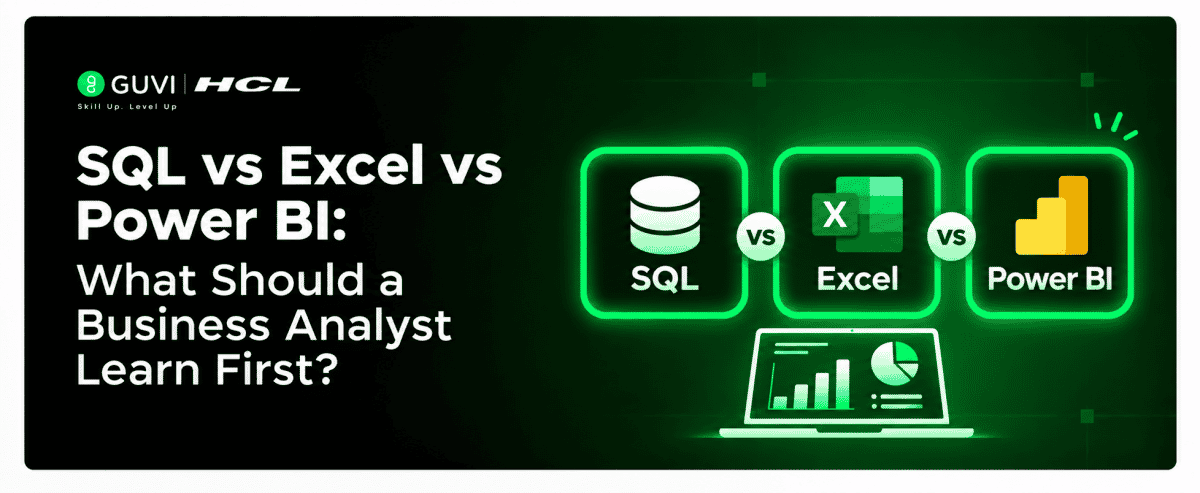
SQL vs Excel vs Power BI: What Should a Business Analyst Learn First?
Nov 21, 2026 4 Min Read 40 Views
(Last Updated)
Should aspiring Business Analysts learn Excel, SQL, or Power BI first? With so many tools mentioned in job descriptions, choosing where to begin can feel confusing.
For most beginners, the best learning order is Excel first, SQL second, and Power BI third. Excel builds confidence in handling data, SQL helps retrieve information from databases, and Power BI turns analysis into interactive reports.
However, your priorities should depend on your target role. Functional Business Analysts may focus more on documentation, while analytics-focused positions require stronger technical skills.
This SQL vs Excel vs Power BI guide compares their applications, explains which tool to prioritize, and provides an eight-week learning roadmap.
Table of contents
- Quick Answer
- SQL vs Excel vs Power BI: What Is the Difference?
- Which Tool Should Business Analysts Learn First?
- Start With Excel for Data Analysis
- Learn SQL for Database Queries
- Move to Power BI for Dashboards
- How Do Excel, SQL, and Power BI Work Together?
- How to Learn Excel, SQL, and Power BI in Eight Weeks
- Step 1. Master Excel Fundamentals (Weeks 1–2)
- Step 2. Build SQL Skills (Weeks 3–4)
- Step 3. Learn Power BI Essentials (Weeks 5–6)
- Step 4. Complete an I
- ntegrated Project (Weeks 7–8)
- Which Skills Matter for Different Business Analyst Roles?
- Does Learning SQL, Excel, and Power BI Improve Your Salary?
- Conclusion
- FAQs
- Is Excel Enough to Become a Business Analyst?
- Should I Learn SQL or Power BI After Excel?
- Is SQL Harder Than Excel?
- Do Business Analysts Need All Three Tools?
- Can I Learn Power BI Without SQL?
Quick Answer
| For most beginners, the best learning order is Excel → SQL → Power BI. Excel helps Business Analysts clean data, perform calculations, and create reports. SQL is useful for retrieving and analyzing information from databases, while Power BI helps build interactive dashboards and track business KPIs. However, the right choice depends on your target role. Functional Business Analysts should prioritize requirements gathering, while data-focused roles benefit from all three tools. |
SQL vs Excel vs Power BI: What Is the Difference?
In the SQL vs Excel vs Power BI comparison, Excel is a spreadsheet application, SQL is used to query relational databases, and Power BI is a business intelligence platform for analyzing and visualizing data.
Although their capabilities overlap, each serves a different purpose in business analysis.
| Feature | Excel | SQL | Power BI |
|---|---|---|---|
| Primary Purpose | Spreadsheet analysis | Database querying | Business reporting |
| Core Skills | Formulas, Pivot Tables | JOINs, aggregations | DAX, dashboards |
| Data Cleaning | Formulas, Power Query | Queries | Power Query |
| Data Sources | Workbooks, connections | Relational databases | Files, databases, services |
| Output | Tables and charts | Query results | Interactive reports |
| Coding Required | Not for basic tasks | SQL queries | Not for basic reports |
| Best Application | Operational analysis | Database analysis | KPI monitoring |
| Learning Priority | First | Second | Third |
According to Microsoft, Excel supports data transformation through Power Query, while Power BI provides additional interactive reporting capabilities.
Key Takeaway: These tools complement one another. Learning all three helps you handle different stages of business data analysis.
Excel, SQL, and Power BI are valuable tools for Business Analysts, but knowing how to apply them to business problems is equally important. Strengthen your data analysis, reporting, and business process analysis skills with HCL GUVI’s Business Analyst Course. Build a strong foundation in analytical thinking and data-driven decision-making.
Which Tool Should Business Analysts Learn First?
The most practical approach to SQL vs Excel vs Power BI is to develop foundational analytical skills before moving into databases and dashboard creation. Each tool builds on your existing knowledge and prepares you for more advanced business analysis tasks.
1. Start With Excel for Data Analysis
Excel is generally the easiest starting point because you can inspect and manipulate data without learning programming syntax.
In the SQL vs Excel vs Power BI learning sequence, Excel comes first because it helps you understand business metrics, perform calculations, and prepare reports.
Essential Skills
- SUMIFS, COUNTIFS, XLOOKUP, and IF
- Sorting, filtering, and data validation
- Pivot Tables and Pivot Charts
- Basic Power Query transformations
Business Example: Analyze customer support tickets to calculate monthly complaint volumes and average resolution times.
Practical Task: Build an Excel report showing three customer service KPIs.
2. Learn SQL for Database Queries
Businesses often store customer, sales, and operational information in relational databases.
For those comparing SQL vs Excel vs Power BI, SQL is the next step because it helps you retrieve relevant records, combine tables, and calculate business metrics.
SQL also allows you to work directly with database information instead of relying entirely on spreadsheets.
Essential Skills
- SELECT, WHERE, and ORDER BY
- GROUP BY and aggregate functions
- INNER JOIN and LEFT JOIN
- Subqueries and CTEs
- Basic window functions
According to Microsoft’s SQL documentation, SELECT retrieves rows and columns from database tables.
Business Example: Join customer and order records to identify repeat customers by region.
Practical Task: Write SQL queries to calculate monthly revenue and identify the five highest-value customers.
3. Move to Power BI for Dashboards
The final stage of the SQL vs Excel vs Power BI learning sequence focuses on presenting insights to stakeholders through interactive dashboards.
Power BI helps you connect data sources, create relationships, calculate KPIs, and develop reports that make business performance easier to understand.
Essential Skills
- Power Query
- Data modeling and relationships
- KPI cards, charts, and slicers
- Basic DAX measures
- Report design and validation
Business Example: Create a sales dashboard showing revenue growth, regional performance, and order trends.
Practical Task: Build a Power BI report with three KPIs, two charts, and a date filter.
Microsoft’s Power BI documentation explains its data modeling, visualization, and reporting capabilities.
- Excel and Power BI both support Power Query, allowing analysts to clean and transform data using similar techniques.
- SQL can analyze information across related database tables without manually combining spreadsheets.
- Power BI reports respond to interactive filters, helping stakeholders investigate business performance across different categories.
How Do Excel, SQL, and Power BI Work Together?
Consider an online retailer investigating declining revenue.

Instead of treating SQL vs Excel vs Power BI as competing technologies, the analyst can use each tool for a different task.
Step 1. Excel for Initial Analysis
Review transaction samples, identify missing information, and check sales calculations.
Step 2. SQL for Detailed Investigation
Combine customer, order, and refund tables. Calculate revenue trends and compare performance across regions.
Step 3. Power BI for Reporting
Create dashboards showing revenue, refunds, order volumes, and monthly trends.
The analyst can then investigate whether cancellations, declining order values, or customer behaviour contributed to the revenue decrease.
Business Outcome: A report supported by consistent calculations and clear business recommendations.
Not every project requires all three tools. The objective is to choose the most suitable approach for the business problem.
How to Learn Excel, SQL, and Power BI in Eight Weeks
A structured roadmap helps beginners develop practical skills without trying to master everything simultaneously.
Step 1. Master Excel Fundamentals (Weeks 1–2)
Learn formulas, Pivot Tables, charts, and data cleaning.
Practical Task: Clean a retail sales workbook and calculate revenue by product category.
Step 2. Build SQL Skills (Weeks 3–4)
Practice database queries, joins, filtering, and aggregations.
Practical Task: Query customer transactions to identify repeat purchases and monthly revenue.
Step 3. Learn Power BI Essentials (Weeks 5–6)
Import datasets, create relationships, build dashboards, and learn basic DAX.
Practical Task: Develop an interactive sales performance report.
Step 4. Complete an I
ntegrated Project (Weeks 7–8)
Select a realistic business problem and combine your technical skills.
Practical Task: Prepare a portfolio project containing cleaned data, SQL queries, a dashboard, and business recommendations.
This is a suggested learning schedule. Actual proficiency depends on previous experience and regular practice.
Which Skills Matter for Different Business Analyst Roles?
The best tool to learn first also depends on the responsibilities of your target position.
| Business Analyst Role | Primary Skills | Supporting Tools |
|---|---|---|
| Functional Business Analyst | Requirements, process mapping | Excel, Jira |
| Technical Business Analyst | SQL, system analysis | Excel, APIs |
| Data-Focused Business Analyst | SQL, Power BI | Excel, statistics |
| Junior Business Analyst | Excel, documentation | Basic SQL |
| Business Intelligence Analyst | Power BI, SQL | DAX, data modeling |
Functional roles may not require advanced SQL or Power BI knowledge. However, understanding these tools can strengthen your analytical capabilities.
Does Learning SQL, Excel, and Power BI Improve Your Salary?
Learning SQL, Excel, and Power BI can help Business Analysts qualify for more technical and data-focused roles. However, salary depends on experience, industry, location, and job responsibilities.
According to Glassdoor, the following are estimated average annual base salaries in India.
| Job Role | Average Annual Base Salary | Relevant Skills |
|---|---|---|
| Business Analyst | ₹8 LPA | Excel, SQL, requirements analysis |
| Data Analyst | ₹6 LPA | Excel, SQL, data analysis |
| Business Intelligence Analyst | ₹8 LPA | Power BI, SQL, DAX |
These estimates cover different experience levels. The Business Analyst and Data Analyst figures are from 2026, while the Business Intelligence Analyst estimate was last updated in 2025.
Learning Excel, SQL, and Power BI can help you analyse data and create meaningful business reports. Take your skills further by developing expertise in requirement gathering, stakeholder communication, and business problem-solving with HCL GUVI’s Business Analyst Course. Prepare to apply your analytical knowledge to real-world business challenges.
Conclusion
For beginners comparing SQL vs Excel vs Power BI, Excel → SQL → Power BI is a practical learning sequence. Excel builds data analysis fundamentals, SQL develops database querying skills, and Power BI helps communicate findings through interactive reports.
However, Business Analysts also need requirements gathering, process analysis, and stakeholder communication skills. Choose tools based on your target role and build practical projects demonstrating how your analysis supports business decisions.
FAQs
Is Excel Enough to Become a Business Analyst?
Excel is useful for entry-level reporting, but many roles also require requirements gathering, process mapping, SQL, or other specialized skills.
Should I Learn SQL or Power BI After Excel?
SQL is generally the better next step for database-focused roles. Power BI can follow for reporting, although dashboard-focused beginners may learn it earlier.
Is SQL Harder Than Excel?
SQL requires learning query syntax and database concepts. Excel is more visual, but beginners can learn basic SQL queries through consistent practice.
Do Business Analysts Need All Three Tools?
No. Requirements-focused positions may prioritize Excel and documentation tools, while data-focused roles often require SQL and Power BI.
Can I Learn Power BI Without SQL?
Yes. You can build reports using Excel files without knowing SQL. SQL becomes useful when working with relational databases and complex data sources.
Success Stories

About the Author
Vaishali
I'm a seasoned writer with four years of experience across technical, non-technical, and just about every genre or niche you can imagine. Adaptable and curious, I enjoy exploring new topics and making information engaging and easy to understand. Fueled by a steady stream of tea, I approach each project with creativity, reliability, and genuine enthusiasm for storytelling.
View all posts by Vaishali
Connect with me @









Did you enjoy this article?