


Introduction to R
Introduction to R
What Is R?
R is a free programming language designed for working with data. It helps you clean datasets, perform statistical analysis, and create charts.
R was created by two statisticians, Ross Ihaka and Robert Gentleman, and is supported by a worldwide community.
With R, you write instructions, execute them, and examine the results. You can start with simple commands and gradually learn more advanced techniques. You do not need to be an experienced programmer to begin.
Features of R
R is popular because it is easy to get started with and powerful enough to support complex data analysis.
Its key features include:
- Free and open source: Anyone can use R at no cost.
- Vectorized operations: A single command can perform calculations on an entire vector or column of numbers.
- Extensive packages: Thousands of additional packages provide tools for data manipulation, visualization, and statistical analysis.
- Data visualization: R can create a wide range of charts and graphs.
- Statistical analysis: It includes functions for statistical tests and modeling.
- Active community: Tutorials, documentation, and online discussions help users learn and solve problems.
Real-World Use Cases of R
R is used across different fields to analyze data and support decision-making.
Field | How R Is Used |
Education | Tracking student performance and attendance |
Healthcare | Studying treatment results and medical research data |
Banking | Measuring financial risk |
Marketing | Evaluating campaign performance |
Academic research | Performing statistical analysis and presenting findings |
These examples show how R can turn raw data into useful information. In this guide, you will apply the same principles to student performance data.
R for Data Science
Harini A

Recommended Handbooks

C++ Handbook

Python Basics Handbook

Javascript Handbook

Building a Random Joke Generator Using ReactJS

Build a Character Counter in React JS

Build Your QR Code Generator using React JS

Build a Birthday Reminder App using React JS

Building BMI Calculator Using ReactJS
Building Random Password Generator using ReactJS
Temperature Converter Project in React
Building a To-Do List App Using ReactJS
Building a Weather App Project Using ReactJS
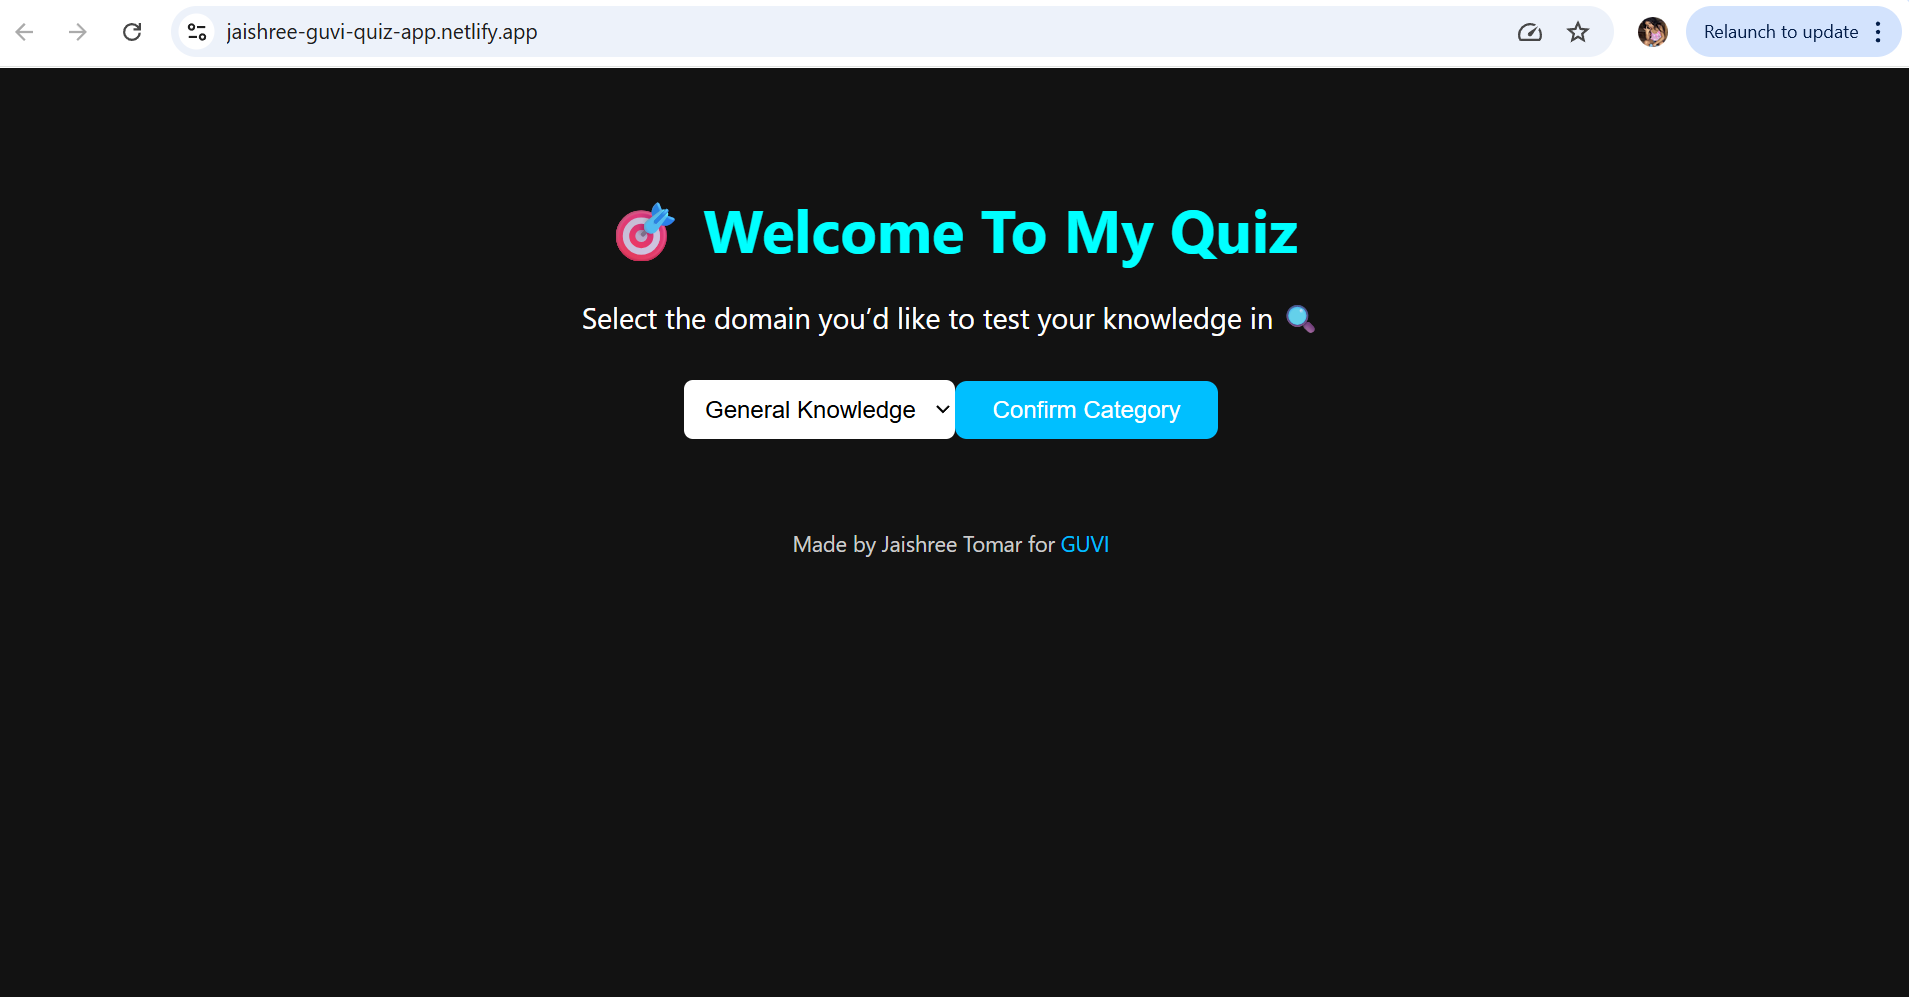
Building a Quiz App in ReactJS
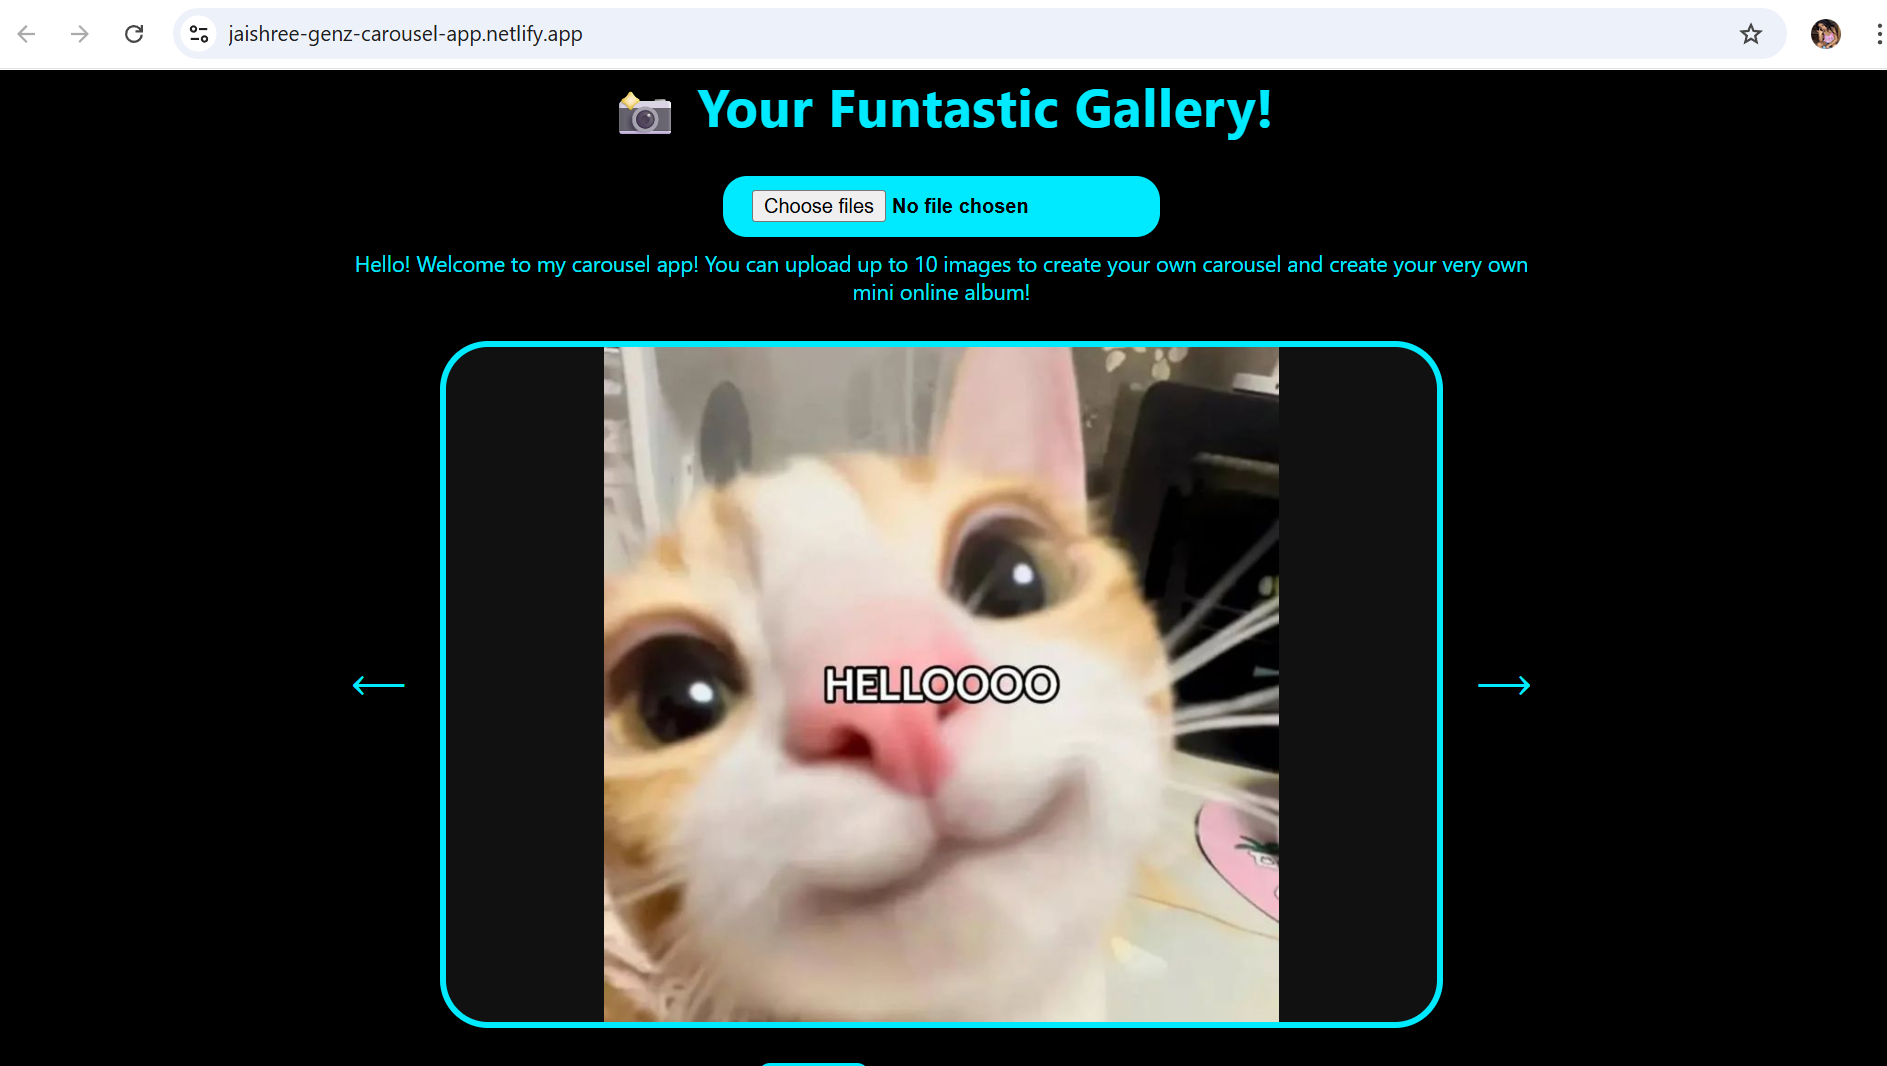
Building a GenZ Carousel App in React
ReactJS Projects Handbook

Computer Networks Tutorial
Operating System Tutorial
DBMS and SQL Tutorial
Java Tutorial

C Language Tutorial

PHP Tutorial

Android Tutorial

Linux Guide Tutorial

Data Structures and Algorithms Tutorial

Computer Architecture

HTML 5 References Tutorial

Docker Tutorial
GIT (Using Github) Tutorial

Go Language Tutorial

GIT Guide

CSS Tutorial
Advanced Data Structures

Spring Framework Tutorial

Spring Boot Tutorial

Kotlin Tutorial

Apache Cordova Tutorial

Python Tutorial
SASS-SCSS Tutorial

MongoDB Tutorial

Numpy Tutorial
PL-SQL Tutorial

Python Built-in Functions Tutorial

Pandas Tutorial

Elasticsearch Tutorial

Matplotlib Tutorial

Web Scraping Tutorial

Networking with Python

Tkinter Tutorial
Java Programs Tutorial
Java Examples Tutorial

Servlet Tutorial

JSP Tutorial
Java Type Conversion Tutorial
Java 8 Tutorial
Java 9 Tutorial
Java 10 Tutorial
Java 11 Tutorial
Java Util Library Tutorial
Building a Contact Us Form in ReactJS

Building a Age Calculator App Using ReactJS
Movie Recommendation System Project Using Content-Based Filtering

Recipe Finder App using ReactJS

Sales Data Analysis Project for Beginners Using Data Science
Student Performance Analysis Project for Beginners Using Data Science

Word Counter Tool Using ReactJS

Customer Churn Prediction Project Using Classification Techniques

Basic Expense Tracker App using ReactJS

Simple Binary to Decimal Converter in React

Real-Time Unit Converter in React
House Price Prediction Using Machine Learning (XGBoost)
Weather Data Analysis and Visualization Using Python

Expandable Accordion Component using React

OTP Verification Component using React

Cricket Data Analysis Using Python

Credit Card Fraud Detection for Beginners using Data Science

Deep learning Tutorial

Software Development Life Cycle Tutorial

Stock Price Prediction for Beginners using Data Science

Apache Kafka Tutorial
Angular Tutorial

Django Tutorial
Computer Programming Tutorial

Tensorflow Tutorial
Java OOPs Concepts Tutorial

Building an Image Classification System Using CNN

News Recommendation System Using Machine Learning

Fake Review Detection System using Machine Learning

Product Feedback App Using Full Stack Development - Customer Review and Rating System

Job Portal with Applicant Tracking System Using Full Stack Development

(FalCon Store) A Modern React-Based E-Commerce App UI with Admin Dashboard

Student Management System using Python (Beginner-Friendly Project Guide)

HTML Tutorial - From Basics to Implementation

Machine Learning Tutorial
ReactJS Tutorial

Hibernate Tutorial

Data Analysis with Python Handbook
Probability and Statistics for Data Science

Artificial Intelligence Tutorial

Power BI Tutorial
SQL for Data Science