


Business Analytics Articles
Using Claude for Personalized Content at Scale
How to Use Claude for YouTube Script writing


Get In Touch For Details! Request More Information
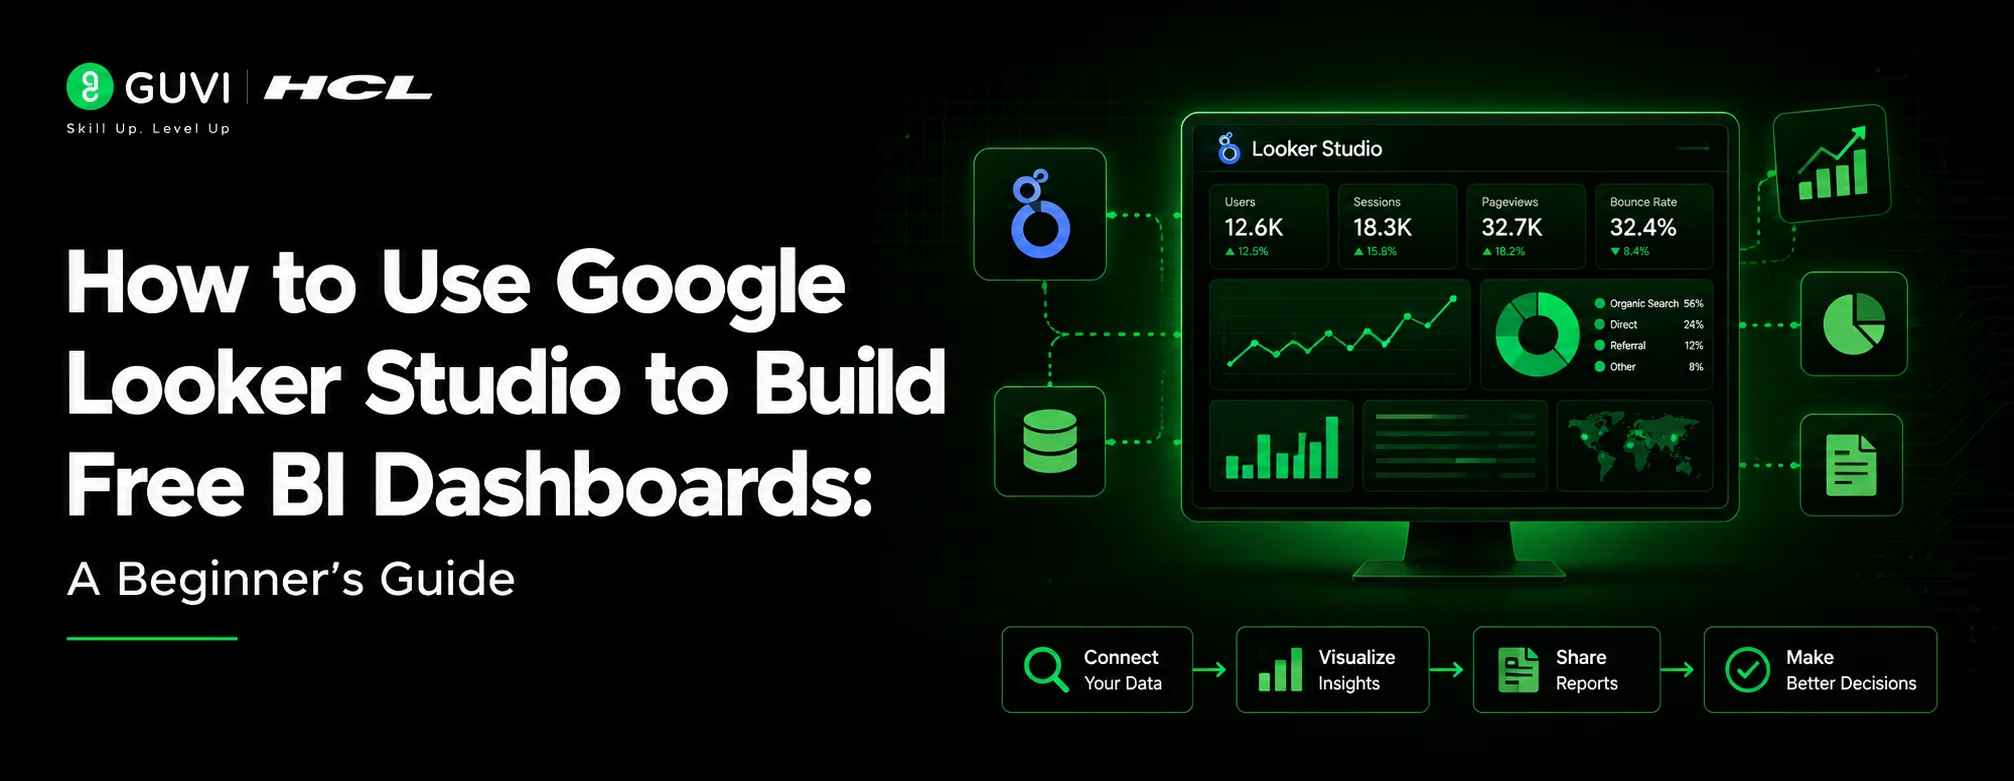
How to Use Google Looker Studio to Build Free BI Dashboards: A Beginner’s Guide
Jul 09, 2026 3 Min Read 367 Views
(Last Updated)
Businesses today are generating more data than ever, but the real challenge is turning that data into decisions. From tracking marketing performance to monitoring sales growth, companies need dashboards that are fast, flexible, and affordable.
The demand for Business Intelligence (BI) skills is growing rapidly as organizations move toward data-driven decision-making. Tools like Google Looker Studio allow beginners, analysts, and business teams to create professional BI dashboards without expensive software licenses.
In this guide, you’ll learn how to use Google Looker Studio to build free BI dashboards, connect your data sources, design interactive reports, and create dashboards that help businesses make smarter decisions.
Table of contents
- TL;DR
- What Is Google Looker Studio?
- Why Are Free BI Dashboards Becoming Popular?
- Step-by-Step: How to Build a Free BI Dashboard Using Google Looker Studio
- Step 1: Create Your Looker Studio Account
- Step 2: Connect Your Data Source
- Step 3: Define Your Dashboard Goals
- Key Performance Indicators (KPIs)
- Step 4: Add Charts and Visual Elements
- Scorecards
- Time Series Charts
- Bar Charts
- Pie Charts
- Tables
- Step 5: Add Filters and Interactivity
- Date Filters
- Category Filters
- Drill-Down Reports
- Step 6: Design a Clean Dashboard Layout
- Keep It Simple
- Use Consistent Colors
- Arrange Information Properly
- Practical Use Cases of Looker Studio Dashboards
- Marketing Dashboard
- Sales Dashboard
- HR Dashboard
- Skills Roadmap: How to Learn Looker Studio for a Data Career
- Career Benefits and Salary Potential
- Common Mistakes Beginners Make
- Adding Too Many Charts
- Ignoring Data Quality
- Not Understanding the Audience
- Conclusion
- Frequently Asked Questions
- Is Google Looker Studio free?
- Do I need coding skills to use Looker Studio?
- What data sources work with Looker Studio?
- Is Looker Studio useful for data analyst jobs?
- Can I share Looker Studio dashboards with others?
- Is Looker Studio better than Excel dashboards?
- How long does it take to learn Looker Studio?
- What should I learn along with Looker Studio?
TL;DR
- Google Looker Studio is a free BI and data visualization tool.
- You can connect sources like Google Sheets, BigQuery, Analytics, and databases.
- A good BI dashboard combines KPIs, charts, filters, and actionable insights.
- Beginners can build dashboards without coding.
- Learning Looker Studio is a valuable skill for data analysts and BI careers.
What Is Google Looker Studio?
Google Looker Studio is a free business intelligence and data visualization platform that converts raw data into interactive dashboards and reports. It helps users connect multiple data sources, analyze performance metrics, and share insights with teams.
Previously known as Google Data Studio, Looker Studio is widely used by marketers, analysts, startups, and enterprises to create real-time dashboards.
A typical Looker Studio dashboard can include:
- Sales reports
- Marketing analytics
- Customer insights
- Financial tracking
- Website performance reports
- Operational dashboards
Why Are Free BI Dashboards Becoming Popular?
Companies no longer want decisions based on assumptions. They want measurable insights.
According to industry reports:
- The global business intelligence market is expected to continue strong growth, driven by increasing data adoption across industries.
- Data analysts and BI professionals remain among the fastest-growing technology roles.
- Organizations using data-driven strategies often report better operational efficiency.
- Cloud-based analytics tools are becoming preferred because they reduce infrastructure costs.
For beginners, this creates an opportunity: learning dashboard-building skills can open doors to roles such as:
| Role | How Looker Studio Helps |
| Data Analyst | Creates reports and visual insights |
| Marketing Analyst | Tracks campaign performance |
| Business Analyst | Supports decision-making |
| Product Analyst | Measures user behavior |
| Reporting Specialist | Automates business reports |
Step-by-Step: How to Build a Free BI Dashboard Using Google Looker Studio
Step 1: Create Your Looker Studio Account
Start by accessing Google Looker Studio using your Google account.
The platform works directly in your browser, so there is no software installation required.
Once inside, you can:
- Create a blank report
- Use templates
- Connect existing data sources
Step 2: Connect Your Data Source
A dashboard is only as useful as the data behind it.
Looker Studio supports many connectors, including:
- Google Sheets
- Google Analytics
- BigQuery
- Search Console
- SQL databases
- CSV files
- Third-party platforms
For beginners, Google Sheets is the easiest starting point.
Example:
Imagine you have a sales sheet containing:
| Date | Product | Revenue | Region |
| Jan 1 | Laptop | $1200 | South |
| Jan 2 | Phone | $800 | North |
Looker Studio can convert this into charts automatically.
Step 3: Define Your Dashboard Goals
Before adding charts, decide what question your dashboard should answer.
Avoid creating dashboards filled with unnecessary visuals.
A good dashboard answers questions like:
- Are sales increasing?
- Which products perform best?
- Which marketing channels generate revenue?
- Where are customers coming from?
A simple business dashboard usually contains:
Key Performance Indicators (KPIs)
Examples:
- Total Revenue
- Number of Customers
- Conversion Rate
- Average Order Value
KPIs give users an immediate understanding of performance.
Step 4: Add Charts and Visual Elements
Looker Studio provides multiple visualization options.
Common dashboard components include:
Scorecards
Used for showing important numbers.
Example:
Monthly Revenue: $250,000
Time Series Charts
Useful for trends.
Example: Tracking revenue growth month by month.
Bar Charts
Great for comparisons.
Example:
Sales by product category.
Pie Charts
Useful for simple proportions.
Example: Customer distribution by region.
Tables
Best for detailed information.
Example: Top 10 products by revenue.
Step 5: Add Filters and Interactivity
A professional BI dashboard should allow users to explore data.
Useful features include:
Date Filters
Users can switch between:
- Last 7 days
- Last month
- Year-to-date
Category Filters
Users can view:
- Specific products
- Regions
- Campaigns
Drill-Down Reports
Users can move from:
Company → Region → Product → Individual transaction

This transforms a static report into an interactive analytics tool.
Step 6: Design a Clean Dashboard Layout
Good dashboards are easy to understand.
Follow these design principles:
Keep It Simple
Avoid adding too many charts.
A dashboard should highlight insights, not overwhelm users.
Use Consistent Colors
Use:
- One primary color
- Supporting colors
- Highlight colors for important metrics
Arrange Information Properly
A common layout:
- KPI cards at the top
- Trends in the middle
- Detailed tables below
Practical Use Cases of Looker Studio Dashboards
Marketing Dashboard
A marketing team can track:
- Website traffic
- Campaign results
- Leads generated
- Conversion rates
Example:
A company notices that one advertising channel produces more customers with lower costs and shifts its budget accordingly.
Sales Dashboard
Sales teams can monitor:
- Revenue trends
- Best-selling products
- Regional performance
- Sales targets
HR Dashboard
HR teams can analyze:
- Employee growth
- Hiring trends
- Attrition rates
Skills Roadmap: How to Learn Looker Studio for a Data Career
If you want to build BI skills, follow this path:
| Stage | Skills to Learn |
| Beginner | Sheets, charts, dashboard basics |
| Intermediate | Data cleaning, calculated fields, filters |
| Advanced | SQL, BigQuery, automation |
| Professional | BI strategy, storytelling with data |
A strong BI professional combines technical skills with business understanding
Career Benefits and Salary Potential
Learning Looker Studio can support careers in analytics and reporting.
Approximate salary ranges vary by location, experience, and company:
| Role | Experience Level |
| Junior Data Analyst | Entry-level |
| BI Analyst | 2–5 years |
| Business Intelligence Developer | 3+ years |
| Analytics Consultant | Experienced |
The tool itself is only one part of the skillset. Combining it with SQL, Excel, Python, and data visualization principles makes you more competitive.
Common Mistakes Beginners Make
1. Adding Too Many Charts
More visuals do not always mean better insights.
Focus on business questions.
2. Ignoring Data Quality
Incorrect or incomplete data creates misleading dashboards.
Always clean your source data first.
3. Not Understanding the Audience
A CEO dashboard and a marketing dashboard should not look identical.
Build dashboards for the people using them.
Conclusion
Google Looker Studio makes business intelligence accessible to everyone. You don’t need expensive tools or advanced programming skills to start analyzing data.
By learning how to connect data sources, create KPIs, design visual reports, and build interactive dashboards, you can develop a valuable analytics skill.
To take your analytics journey further, explore the HCL GUVI Business Analyst Course and learn essential skills like data analysis, BI tools, and business decision-making.
Your next step: pick a simple dataset, create your first dashboard, and practice turning numbers into decisions.
Frequently Asked Questions
1. Is Google Looker Studio free?
Yes. Google Looker Studio offers a free version that allows users to create dashboards and reports.
2. Do I need coding skills to use Looker Studio?
No. Beginners can create dashboards using drag-and-drop features. SQL and technical skills help for advanced use cases.
3. What data sources work with Looker Studio?
It supports Google products, spreadsheets, databases, and many third-party connectors.
4. Is Looker Studio useful for data analyst jobs?
Yes. Dashboard creation and reporting are common responsibilities in analytics roles.
5. Can I share Looker Studio dashboards with others?
Yes. Reports can be shared with teams using permissions similar to Google Docs.
6. Is Looker Studio better than Excel dashboards?
It depends on the use case. Looker Studio is better for interactive, cloud-based dashboards, while Excel is useful for spreadsheet analysis.
7. How long does it take to learn Looker Studio?
Basic dashboards can be created within a few hours. Becoming proficient usually takes practice with real datasets.
8. What should I learn along with Looker Studio?
Learn SQL, Excel, data visualization, business metrics, and basic analytics concepts to become job-ready.
Success Stories

About the Author
Salini Balasubramaniam
A curious, information-savvy writer loves to turn deep insights into authentic and engaging content that connects. With experience in writing for brands and driving audience engagement, I believe that words can make a powerful difference.
View all posts by Salini Balasubramaniam
Connect with me @













Did you enjoy this article?