


Performance Trends With Attendance
Lesson 1: Performance Trends With Attendance
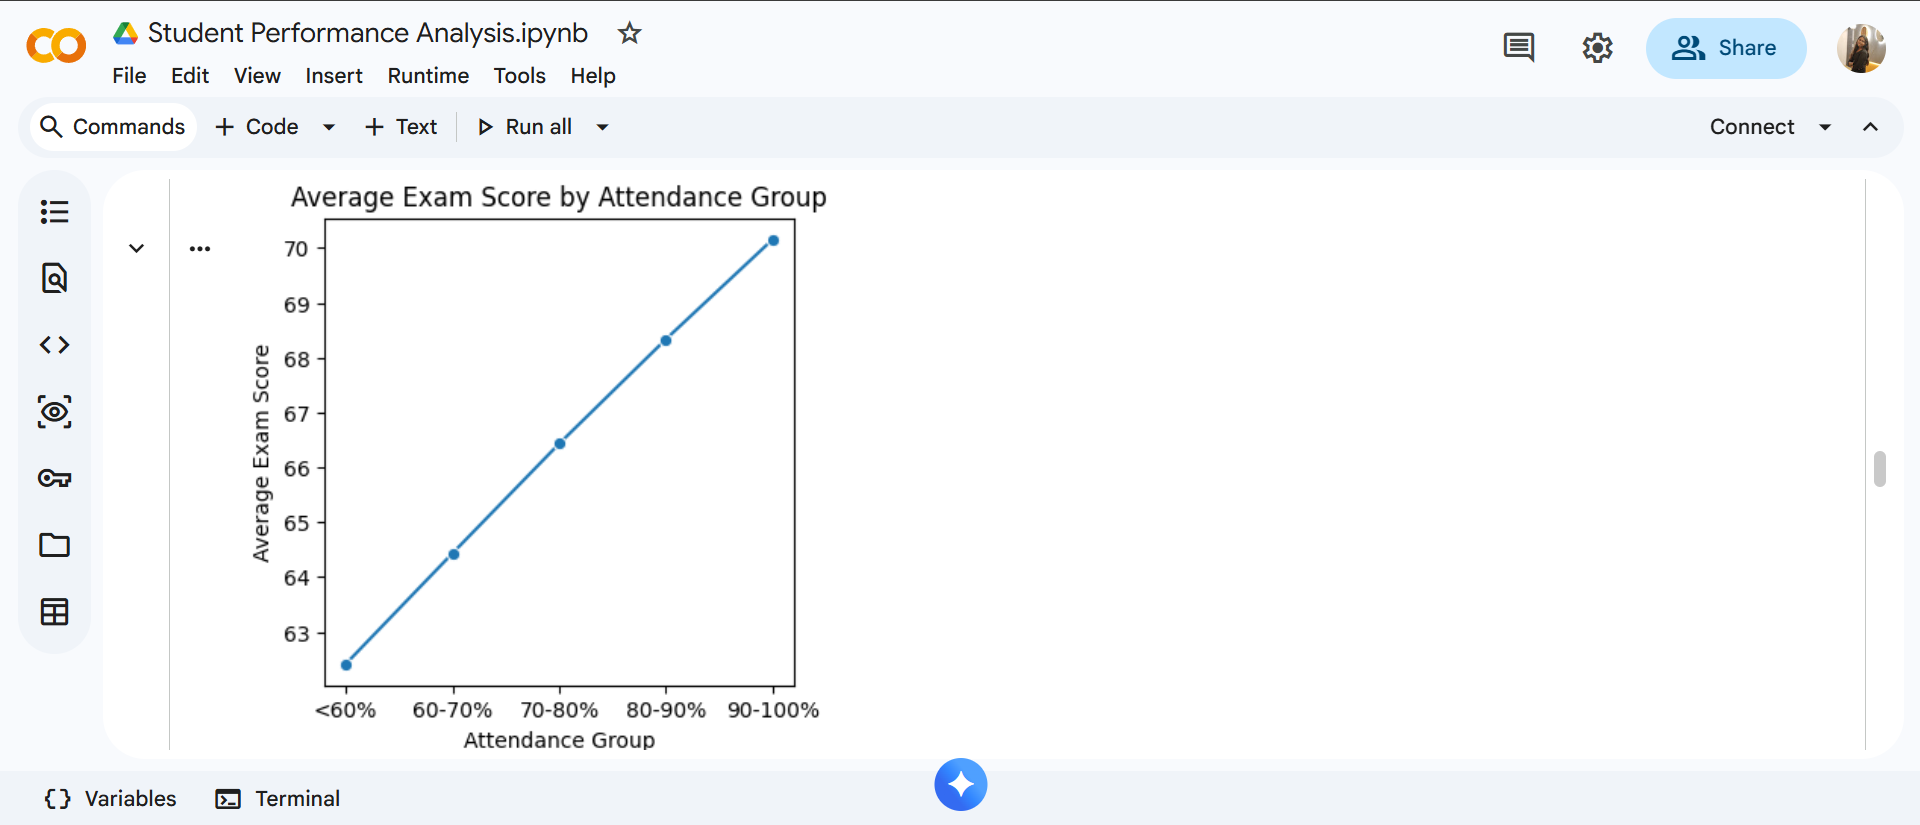
Understanding how attendance influences academic performance is an important part of student analysis. In this lesson, we examine whether students with higher attendance percentages tend to achieve better exam scores. This helps determine whether consistent classroom participation has a measurable impact on academic success.
To make the analysis clearer, attendance percentages are grouped into defined ranges. Then, the average exam score is calculated for each attendance group. Finally, a line chart is used to visualize how performance changes across attendance levels.
Code:
# Group students by attendance bins to analyze average exam scores
attendance_bins = [0, 60, 70, 80, 90, 100]
attendance_labels = ['<60%', '60-70%', '70-80%', '80-90%', '90-100%']
df['Attendance_Group'] = pd.cut(df['Attendance'], bins=attendance_bins, labels=attendance_labels)
# Calculate average exam score per attendance group
attendance_performance = df.groupby('Attendance_Group')['Exam_Score'].mean().reset_index()
# Plot the results
plt.figure(figsize=(4,4))
sns.lineplot(
data=attendance_performance,
x='Attendance_Group',
y='Exam_Score',
marker='o'
)
plt.title("Average Exam Score by Attendance Group")
plt.xlabel("Attendance Group")
plt.ylabel("Average Exam Score")
plt.show()
Insights:
The output is a linear graph that generally increases as attendance increases, indicating that students with higher attendance tend to score better.


