


Performance Comparison Between Previous Scores and Exam Scores
Lesson 2: Performance Comparison Between Previous Scores and Exam Scores
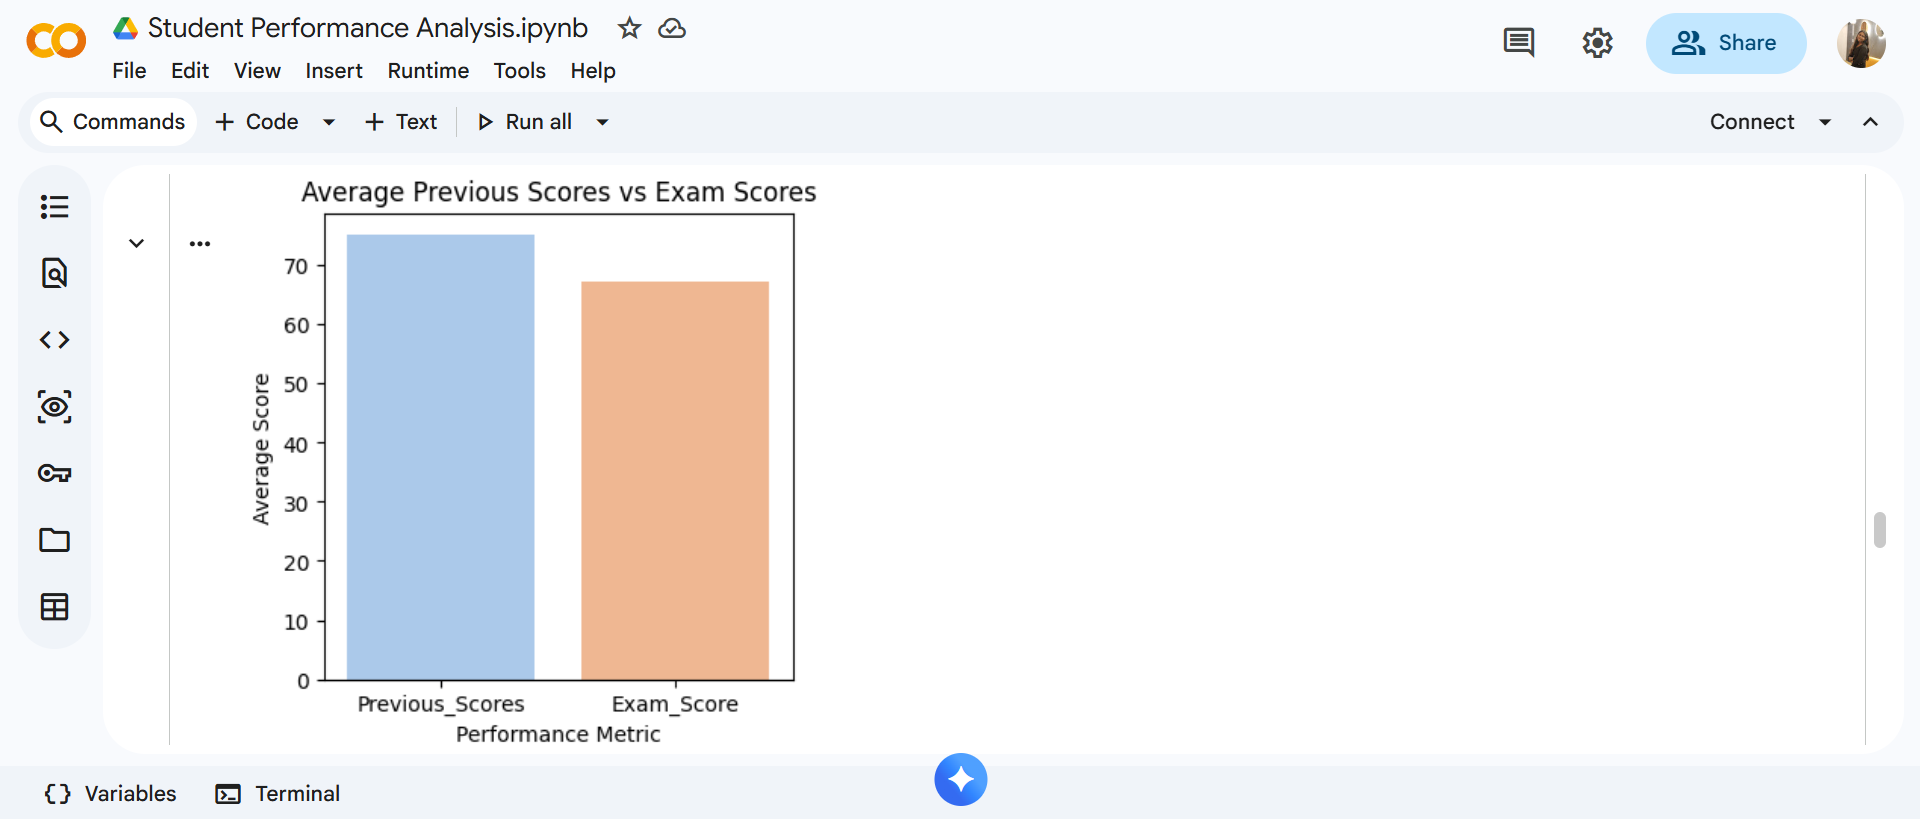
In this lesson, we compare students’ previous academic performance with their current exam scores. This helps us understand whether past performance aligns with present results and whether students maintain consistent academic levels over time.
To perform this comparison, we calculate the average of both Previous_Scores and Exam_Score. A bar chart is then used to visually compare the two performance metrics.
Code:
# Columns to analyze
performance_cols = ['Previous_Scores', 'Exam_Score']
# Calculate average scores
performance_avg = df[performance_cols].mean().reset_index()
performance_avg.columns = ['Performance_Metric', 'Average_Score']
# Plot the results
plt.figure(figsize=(4,4))
sns.barplot(
data=performance_avg,
x='Performance_Metric',
y='Average_Score',
palette='pastel'
)
plt.title("Average Previous Scores vs Exam Scores")
plt.xlabel("Performance Metric")
plt.ylabel("Average Score")
plt.show()
Insights:
The output is a bar chart with similar bars, showing that the average Previous_Scores are slightly higher than Exam_Score. This indicates a small decrease or overall consistency in performance from previous assessments to final exams.


