


Correlation Analysis Between Academic Factors and Exam Score
Lesson 4: Correlation Analysis Between Academic Factors and Exam Score
In this lesson, we analyze the relationship between multiple numeric factors and Exam_Score using correlation analysis. Correlation helps measure how strongly two variables are related and whether the relationship is positive or negative.
To perform this analysis, we first select key numeric columns related to academic performance and student habits. Then, we compute the correlation matrix and visualize it using a heatmap. The heatmap makes it easy to identify which factors strongly influence exam performance.
Code:
# Select numeric columns for correlation
numeric_cols = ['Hours_Studied', 'Attendance', 'Sleep_Hours', 'Previous_Scores', 'Tutoring_Sessions', 'Physical_Activity', 'Exam_Score']
# Compute correlation matrix
corr_matrix = df[numeric_cols].corr()
# Plot heatmap
plt.figure(figsize=(10,6))
sns.heatmap(corr_matrix, annot=True, cmap='coolwarm', fmt=".2f")
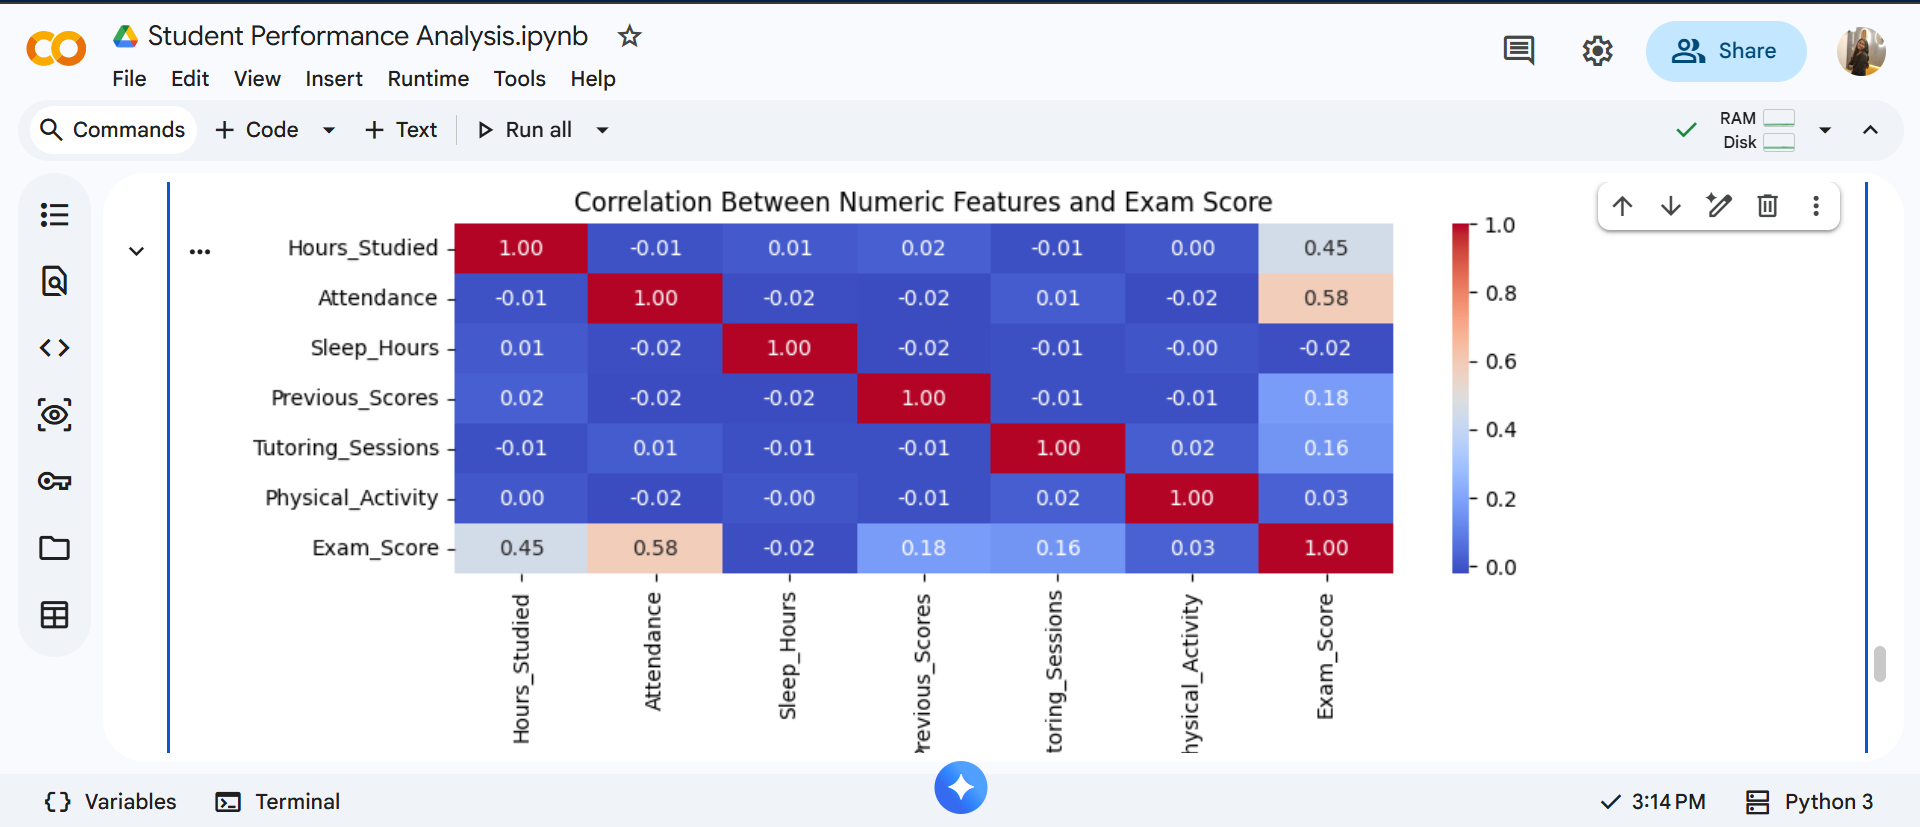
plt.title("Correlation Between Numeric Features and Exam Score")
plt.show()
Insights:
The output heatmap shows that Attendance (0.58) and Hours_Studied (0.45) have a strong positive correlation with Exam_Score.
Other features like Previous_Scores (0.18), Tutoring_Sessions (0.16), and Physical_Activity (0.03) have weak positive correlation, while Sleep_Hours (-0.02) has almost no effect.
This indicates that higher attendance and more study hours significantly contribute to better exam performance.


