


Revenue Trends Over Time
Lesson 1: Revenue Trends Over Time
Understanding revenue trends over time helps identify growth patterns, seasonal behavior, and periods of strong or weak performance. In this project, revenue trends are analyzed by grouping sales data over time to observe how total revenue changes month by month.
Code:
# Group sales by year and month to analyze revenue trends
monthly_revenue = df.groupby(['YEAR_ID','MONTH_ID'])['SALES'].sum().reset_index()
monthly_revenue
plt.figure(figsize=(8,4))
sns.lineplot(
data=monthly_revenue,
x='MONTH_ID',
y='SALES',
hue='YEAR_ID',
marker='o'
)
plt.title("Monthly Revenue Trend by Year")
plt.xlabel("Month")
plt.ylabel("Total Sales")
plt.show()
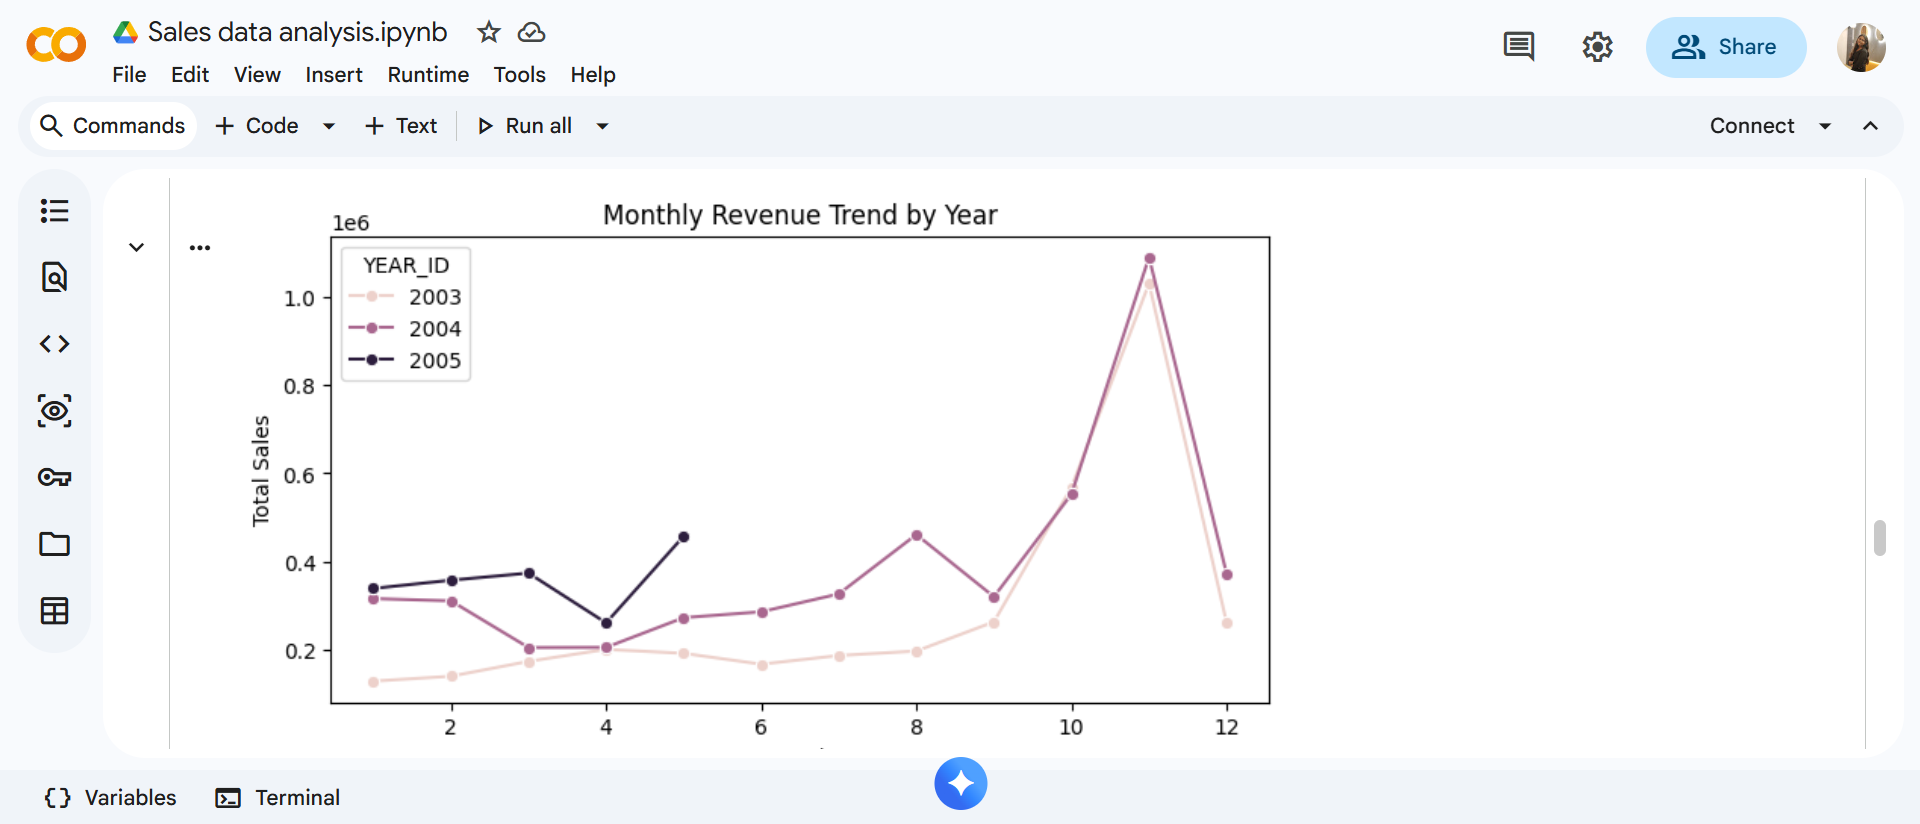
Insights:
The line chart clearly shows how revenue changes over time. Line charts are used here because they are best suited for identifying trends and patterns across continuous time periods. Peaks indicate high-performing months, while drops may point to seasonal slowdowns or external factors affecting sales.


