


Exploratory Data Analysis (EDA)
Exploratory Data Analysis (EDA)
Exploratory Data Analysis is performed to understand patterns and trends within the data before building the recommendation model. EDA helps answer questions such as how users rate movies and which genres are most common.
First, we analyze the distribution of ratings across the dataset.
Code:
import matplotlib.pyplot as plt
plt.figure(figsize=(6,4))
ratings['rating'].hist(bins=20, edgecolor='black')
plt.title("Ratings Distribution")
plt.xlabel("Rating")
plt.ylabel("Count")
plt.show()
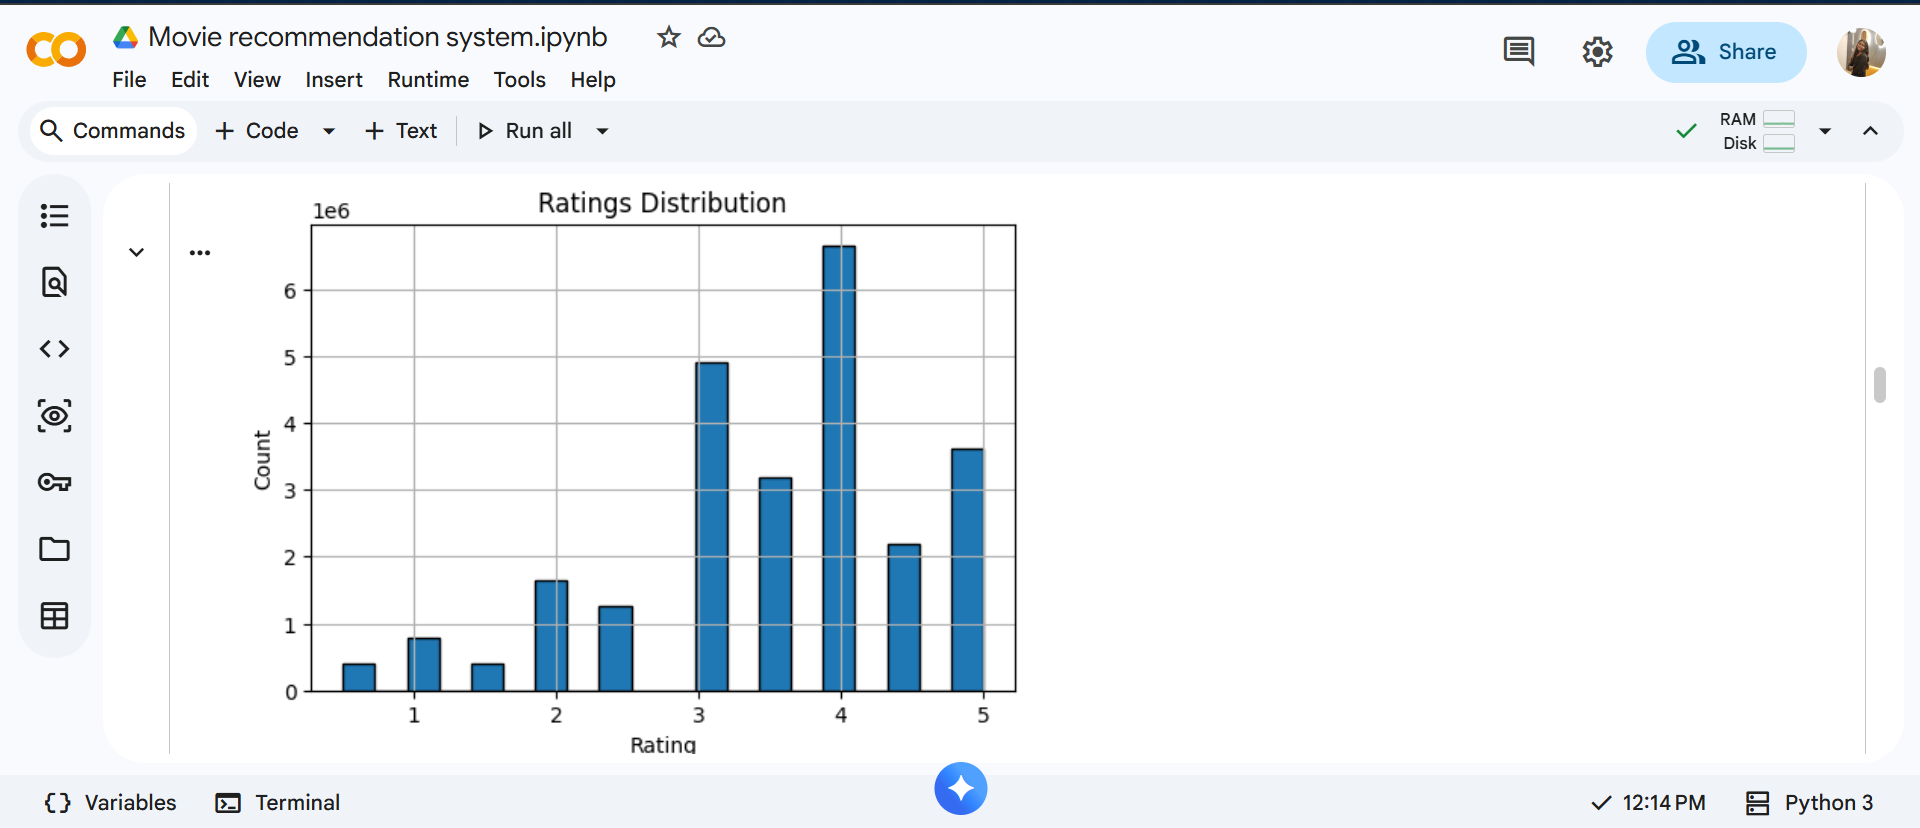
This visualization shows how frequently each rating value occurs. Understanding this distribution is important because ratings later influence how recommendations are ranked. For example, if most ratings cluster around higher values, popularity becomes a strong signal.
Next, we analyze the frequency of genres.
Code:
from collections import Counter
genre_counts = Counter("|".join(movies['genres']).split("|"))
plt.figure(figsize=(8,5))
plt.bar(genre_counts.keys(), genre_counts.values())
plt.xticks(rotation=90)
plt.title("Genre Frequency")
plt.show()
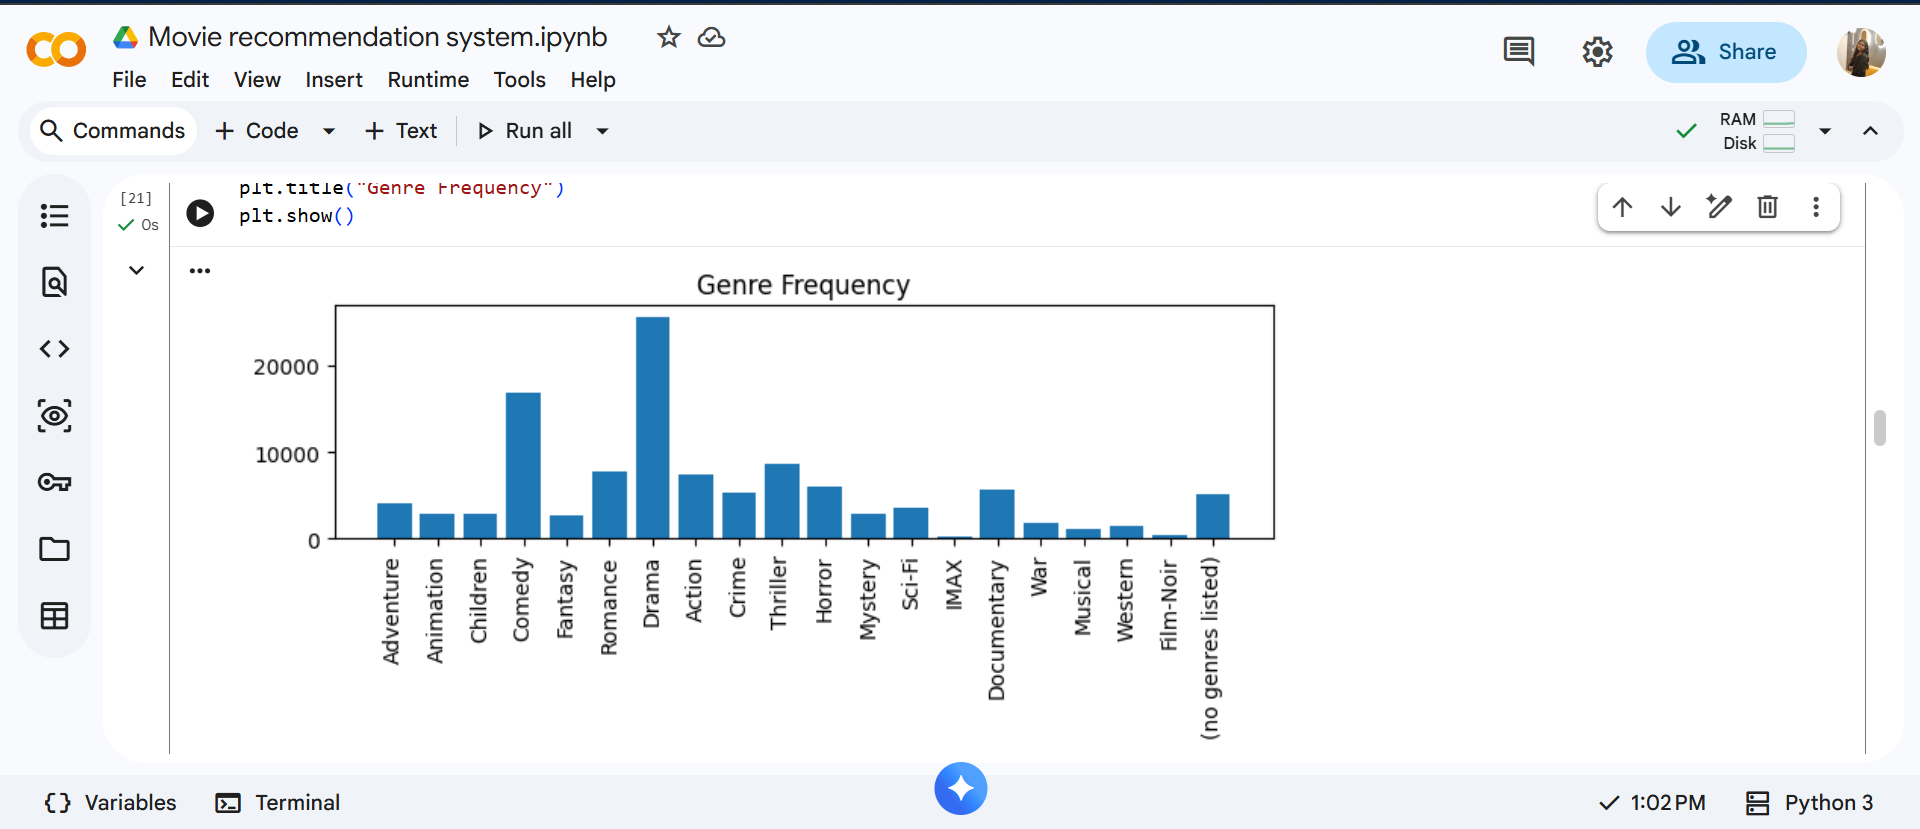
This analysis reveals which genres dominate the dataset. Genres such as Drama and Comedy often appear more frequently, which naturally affects recommendation outcomes and explains why certain genres appear more often in results.


