Data Analyst Bundle
logo

IPL Cricket Analytics – Decode Every Match with Data!

Analyze real IPL match data and uncover player and team performance insights

Learn Python, data analysis, and visualization through hands-on cricket-based projects

Build job-ready data analytics skills using real-world sports datasets

Just ₹499/- Actual ₹9999

--
Days
--
Hours
--
Minutes
--
Seconds

10K people registered already!

Name*
Phone*
  • Andorra(+376)
  • United Arab Emirates(+971)
  • Afghanistan(+93)
  • Antigua & Barbuda(+1 268)
  • Anguilla(+1 264)
  • Albania(+355)
  • Armenia(+374)
  • Angola(+244)
  • Antarctica(+8)
  • Argentina(+54)
  • Samoa (American)(+1 684)
  • Austria(+43)
  • Australia(+61)
  • Aruba(+297)
  • Åland Islands(+358 18)
  • Azerbaijan(+994)
  • Bosnia & Herzegovina(+387)
  • Barbados(+1 246)
  • Bangladesh(+880)
  • Belgium(+32)
  • Burkina Faso(+226)
  • Bulgaria(+359)
  • Bahrain(+973)
  • Burundi(+257)
  • Benin(+229)
  • St Barthelemy(+590)
  • Bermuda(+1 441)
  • Brunei(+673)
  • Bolivia(+591)
  • Caribbean NL(+599)
  • Brazil(+55)
  • Bahamas(+1 242)
  • Bhutan(+975)
  • Botswana(+267)
  • Belarus(+375)
  • Belize(+501)
  • Canada(+1)
  • Cocos (Keeling) Islands(+61)
  • Congo (Dem. Rep.)(+243)
  • Central African Rep.(+236)
  • Congo (Rep.)(+242)
  • Switzerland(+41)
  • Côte d'Ivoire(+225)
  • Cook Islands(+682)
  • Chile(+56)
  • Cameroon(+237)
  • China(+86)
  • Colombia(+57)
  • Costa Rica(+506)
  • Cuba(+53)
  • Cape Verde(+238)
  • Curaçao(+599)
  • Christmas Island(+61)
  • Cyprus(+357)
  • Czech Republic(+420)
  • Germany(+49)
  • Djibouti(+253)
  • Denmark(+45)
  • Dominica(+1 767)
  • Dominican Republic(+1 809)
  • Algeria(+213)
  • Ecuador(+593)
  • Estonia(+372)
  • Egypt(+20)
  • Western Sahara(+212)
  • Eritrea(+291)
  • Spain(+34)
  • Ethiopia(+251)
  • Finland(+358)
  • Fiji(+679)
  • Falkland Islands(+500)
  • Micronesia(+691)
  • Faroe Islands(+298)
  • France(+33)
  • Gabon(+241)
  • Britain (UK)(+44)
  • Grenada(+1 473)
  • Georgia(+995)
  • French Guiana(+594)
  • Guernsey(+44 1481)
  • Ghana(+233)
  • Gibraltar(+350)
  • Greenland(+299)
  • Gambia(+220)
  • Guinea(+224)
  • Guadeloupe(+590)
  • Equatorial Guinea(+240)
  • Greece(+30)
  • South Georgia & the South Sandwich Islands(+99)
  • Guatemala(+502)
  • Guam(+1 671)
  • Guinea-Bissau(+245)
  • Guyana(+592)
  • Hong Kong(+852)
  • Honduras(+504)
  • Croatia(+385)
  • Haiti(+509)
  • Hungary(+36)
  • Indonesia(+62)
  • Ireland(+353)
  • Israel(+972)
  • Isle of Man(+44 1624)
  • India(+91)
  • British Indian Ocean Territory(+246)
  • Iraq(+964)
  • Iran(+98)
  • Iceland(+354)
  • Italy(+39)
  • Jersey(+44 1534)
  • Jamaica(+1 876)
  • Jordan(+962)
  • Japan(+81)
  • Kenya(+254)
  • Kyrgyzstan(+996)
  • Cambodia(+855)
  • Kiribati(+686)
  • Comoros(+269)
  • St Kitts & Nevis(+1 869)
  • Korea (North)(+850)
  • Korea (South)(+82)
  • Kuwait(+965)
  • Cayman Islands(+1 345)
  • Kazakhstan(+7)
  • Laos(+856)
  • Lebanon(+961)
  • St Lucia(+1 758)
  • Liechtenstein(+423)
  • Sri Lanka(+94)
  • Liberia(+231)
  • Lesotho(+266)
  • Lithuania(+370)
  • Luxembourg(+352)
  • Latvia(+371)
  • Libya(+218)
  • Morocco(+212)
  • Monaco(+377)
  • Moldova(+373)
  • Montenegro(+382)
  • St Martin (French)(+590)
  • Madagascar(+261)
  • Marshall Islands(+692)
  • North Macedonia(+389)
  • Mali(+223)
  • Myanmar (Burma)(+95)
  • Mongolia(+976)
  • Macau(+853)
  • Northern Mariana Islands(+ 1 670)
  • Martinique(+596)
  • Mauritania(+222)
  • Montserrat(+1 664)
  • Malta(+356)
  • Mauritius(+230)
  • Maldives(+960)
  • Malawi(+265)
  • Mexico(+52)
  • Malaysia(+60)
  • Mozambique(+258)
  • Namibia(+264)
  • New Caledonia(+687)
  • Niger(+227)
  • Norfolk Island(+672)
  • Nigeria(+234)
  • Nicaragua(+505)
  • Netherlands(+31)
  • Norway(+47)
  • Nepal(+977)
  • Nauru(+674)
  • Niue(+683)
  • New Zealand(+64)
  • Oman(+968)
  • Panama(+507)
  • Peru(+51)
  • French Polynesia(+689)
  • Papua New Guinea(+675)
  • Philippines(+63)
  • Pakistan(+92)
  • Poland(+48)
  • St Pierre & Miquelon(+508)
  • Pitcairn(+870)
  • Puerto Rico(+1 787)
  • Palestine(+970)
  • Portugal(+351)
  • Palau(+680)
  • Paraguay(+595)
  • Qatar(+974)
  • Réunion(+262)
  • Romania(+40)
  • Serbia(+381)
  • Russia(+7)
  • Rwanda(+250)
  • Saudi Arabia(+966)
  • Solomon Islands(+677)
  • Seychelles(+248)
  • Sudan(+249)
  • Sweden(+46)
  • Singapore(+65)
  • St Helena(+290)
  • Slovenia(+386)
  • Svalbard & Jan Mayen(+47)
  • Slovakia(+421)
  • Sierra Leone(+232)
  • San Marino(+378)
  • Senegal(+221)
  • Somalia(+252)
  • Suriname(+597)
  • South Sudan(+211)
  • Sao Tome & Principe(+239)
  • El Salvador(+503)
  • St Maarten (Dutch)(+599)
  • Syria(+963)
  • Eswatini (Swaziland)(+268)
  • Turks & Caicos Is(+1 649)
  • Chad(+235)
  • French Southern Territories(+99)
  • Togo(+228)
  • Thailand(+66)
  • Tajikistan(+992)
  • Tokelau(+690)
  • East Timor(+670)
  • Turkmenistan(+993)
  • Tunisia(+216)
  • Tonga(+676)
  • Turkey(+90)
  • Trinidad & Tobago(+1 868)
  • Tuvalu(+688)
  • Taiwan(+886)
  • Tanzania(+255)
  • Ukraine(+380)
  • Uganda(+256)
  • US minor outlying islands(+1)
  • United States(+1)
  • Uruguay(+598)
  • Uzbekistan(+998)
  • Vatican City(+379)
  • St Vincent(+1 784)
  • Venezuela(+58)
  • Virgin Islands (UK)(+1 284)
  • Virgin Islands (US)(+1 340)
  • Vietnam(+84)
  • Vanuatu(+678)
  • Wallis & Futuna(+681)
  • Samoa (western)(+685)
  • Yemen(+967)
  • Mayotte(+262)
  • South Africa(+27)
  • Zambia(+260)
  • Zimbabwe(+263)
Please fill all the required fields!
Please accept terms and conditions to proceed

Republic Day Sale!

Turn Numbers into Narratives – Become a Data Analyst with One Bundle!

  • Build the skills companies expect from modern data analysts.
  • Master Excel, SQL, Python, and data visualization through hands-on projects.
  • Graduate with real-world experience and confidence to crack analyst roles.

Just ₹1499/- Actual ₹9999

Get Premium Pass Now

4.7/5 Rating

Language: English

10,000+ Enrolled

9+

Years of Experience

250+

Certifications

49K

Students Enrolled

4.4 ⭐️

Google Reviews (10,643)

Republic Day Sale!

Turn Numbers into Narratives – Become a Data Analyst with One Bundle!

Build the skills companies expect from modern data analysts.

Master Excel, SQL, Python, and data visualization through hands-on projects.

Graduate with real-world experience and confidence to crack analyst roles.

Just ₹1499/-  Actual  ₹50000 

Get your IPL Cricket Analytics Course now 

For just ₹499 (85% OFF!) – original price ₹9,999!

--
Days
--
Hours
--
Minutes
--
Seconds

This special IPL season offer is available only for a short time—don’t miss your chance to learn data analytics through cricket.

Free Certificates

Instant Access

Lifetime Access

7-Day Money-Back

Instant Access

Lifetime Access

Free Certificates

Instant Access

Lifetime Access

Start your journey to Data Analyst Bundle now

For just ₹1499 (85% OFF!) – original price ₹9,999!

--
Days
--
Hours
--
Minutes
--
Seconds

Hurry, this exclusive offer is available for a short time!

Free Certificates

Instant Access

Lifetime Access

7-Day Money-Back

Instant Access

Lifetime Access

Free Certificates

Instant Access

Lifetime Access

Who This Course Is Perfect For

Students

Who loves to play with data , build strong fundamentals, and earn certificates that add weight to their resume.

Freshers

Who need job-ready skills, projects, and a portfolio to stand out during placement drives and interviews.

Working Professionals

Who are looking for a salary hike, skill upgrade, or career growth by mastering in-demand technologies.

Career Switchers

From both tech and non-tech backgrounds who want to transition into a high-growth tech career with practical, industry-aligned learning.

IPL Cricket Analytics Course Overview

The IPL Cricket Analytics course gives you a structured, industry-relevant learning path to master data analytics using real cricket datasets. Learn how to analyze matches, evaluate player performance, and extract actionable insights using Python and data science techniques.

Globally Recognized Certification

100% Online & Self-Paced Learning

Lifetime Access to Courses

24/7 Dedicated Forum Support

4 Gamified Practice Platforms

7 Days Refund Policy.

We are accredited by 

Get Access to IPL Cricket Analytics Course with Industry-Recognized Certification

₹9,999 → ₹499 You Save ₹9,500!

LIMITED TIME IPL OFFER 

Cricket Analytics Curriculum

What You Will Learn in This Data Analytics Course

Beginner Module

Intermediate Module

Advanced Module

Expert Module

Earn Industry-Recognized Certificates

Each time you complete a course in the Data Analyst Bundle, you’ll receive a professional certificate issued by HCL GUVI (an IIT-M & IIM-A incubated EdTech company). All certificates are ISO-certified, globally recognized, and shareable on LinkedIn and resumes, helping you showcase your skills, boost your profile, and stand out to recruiters.

Industry-Recognized Credentials

Get certificates that are valued by recruiters and tech companies.

Shareable on LinkedIn

Add every completed-course certificate to LinkedIn and impress potential employers with consistent growth.

Proof of Real Skills

Every certificate reflects practical knowledge and tools you’ve mastered — evidence of real, job-ready skills.

Resume-Ready Format

Download each certificate instantly and attach it to job applications, portfolios, and resumes effortlessly.

Earn Industry-Recognized IPL Cricket Analytics Certificates

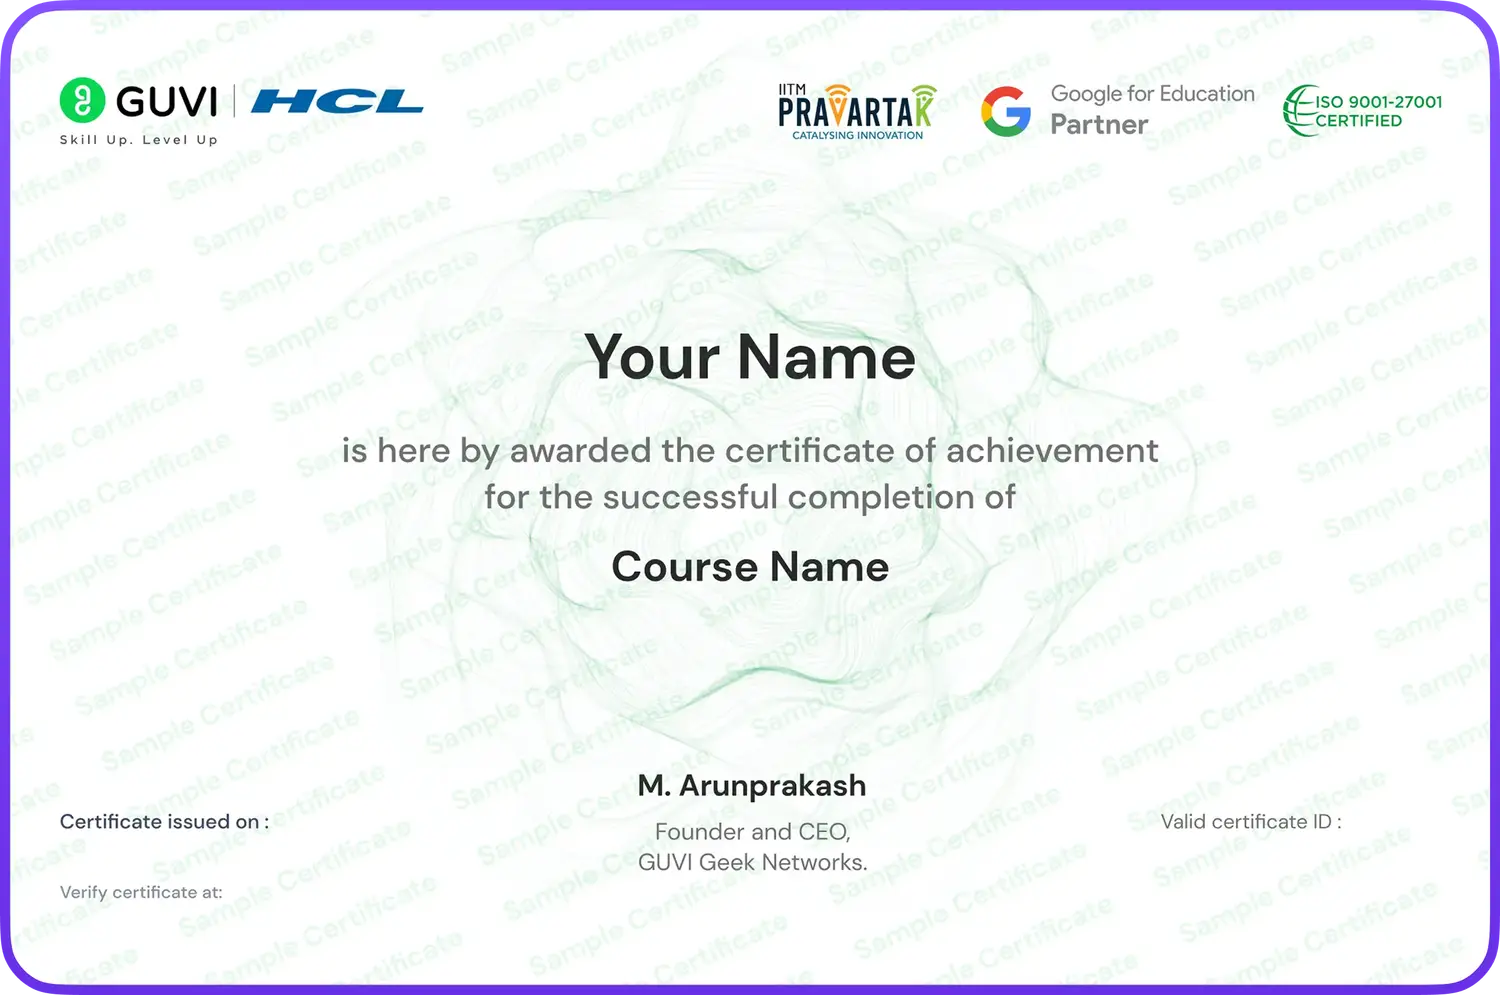
Upon completing the IPL Cricket Analytics course, you’ll receive a professional certificate issued by GUVI (an IIT-M & IIM-A incubated EdTech company). These certifications are globally recognized and designed to strengthen your profile in data analytics and sports analytics.

Certify Your Skills with the Premium Pass

Industry-Recognized Credentials

Earn certificates valued by recruiters and companies in data science and analytics domains.

Shareable on LinkedIn

Add your certificate to LinkedIn and showcase your expertise in data-driven sports analysis.

Proof of Real Skills

Demonstrate hands-on experience in analyzing real IPL datasets and extracting meaningful insights.

Resume-Ready Format

Download instantly and include in your resume, portfolio, or job applications with ease.
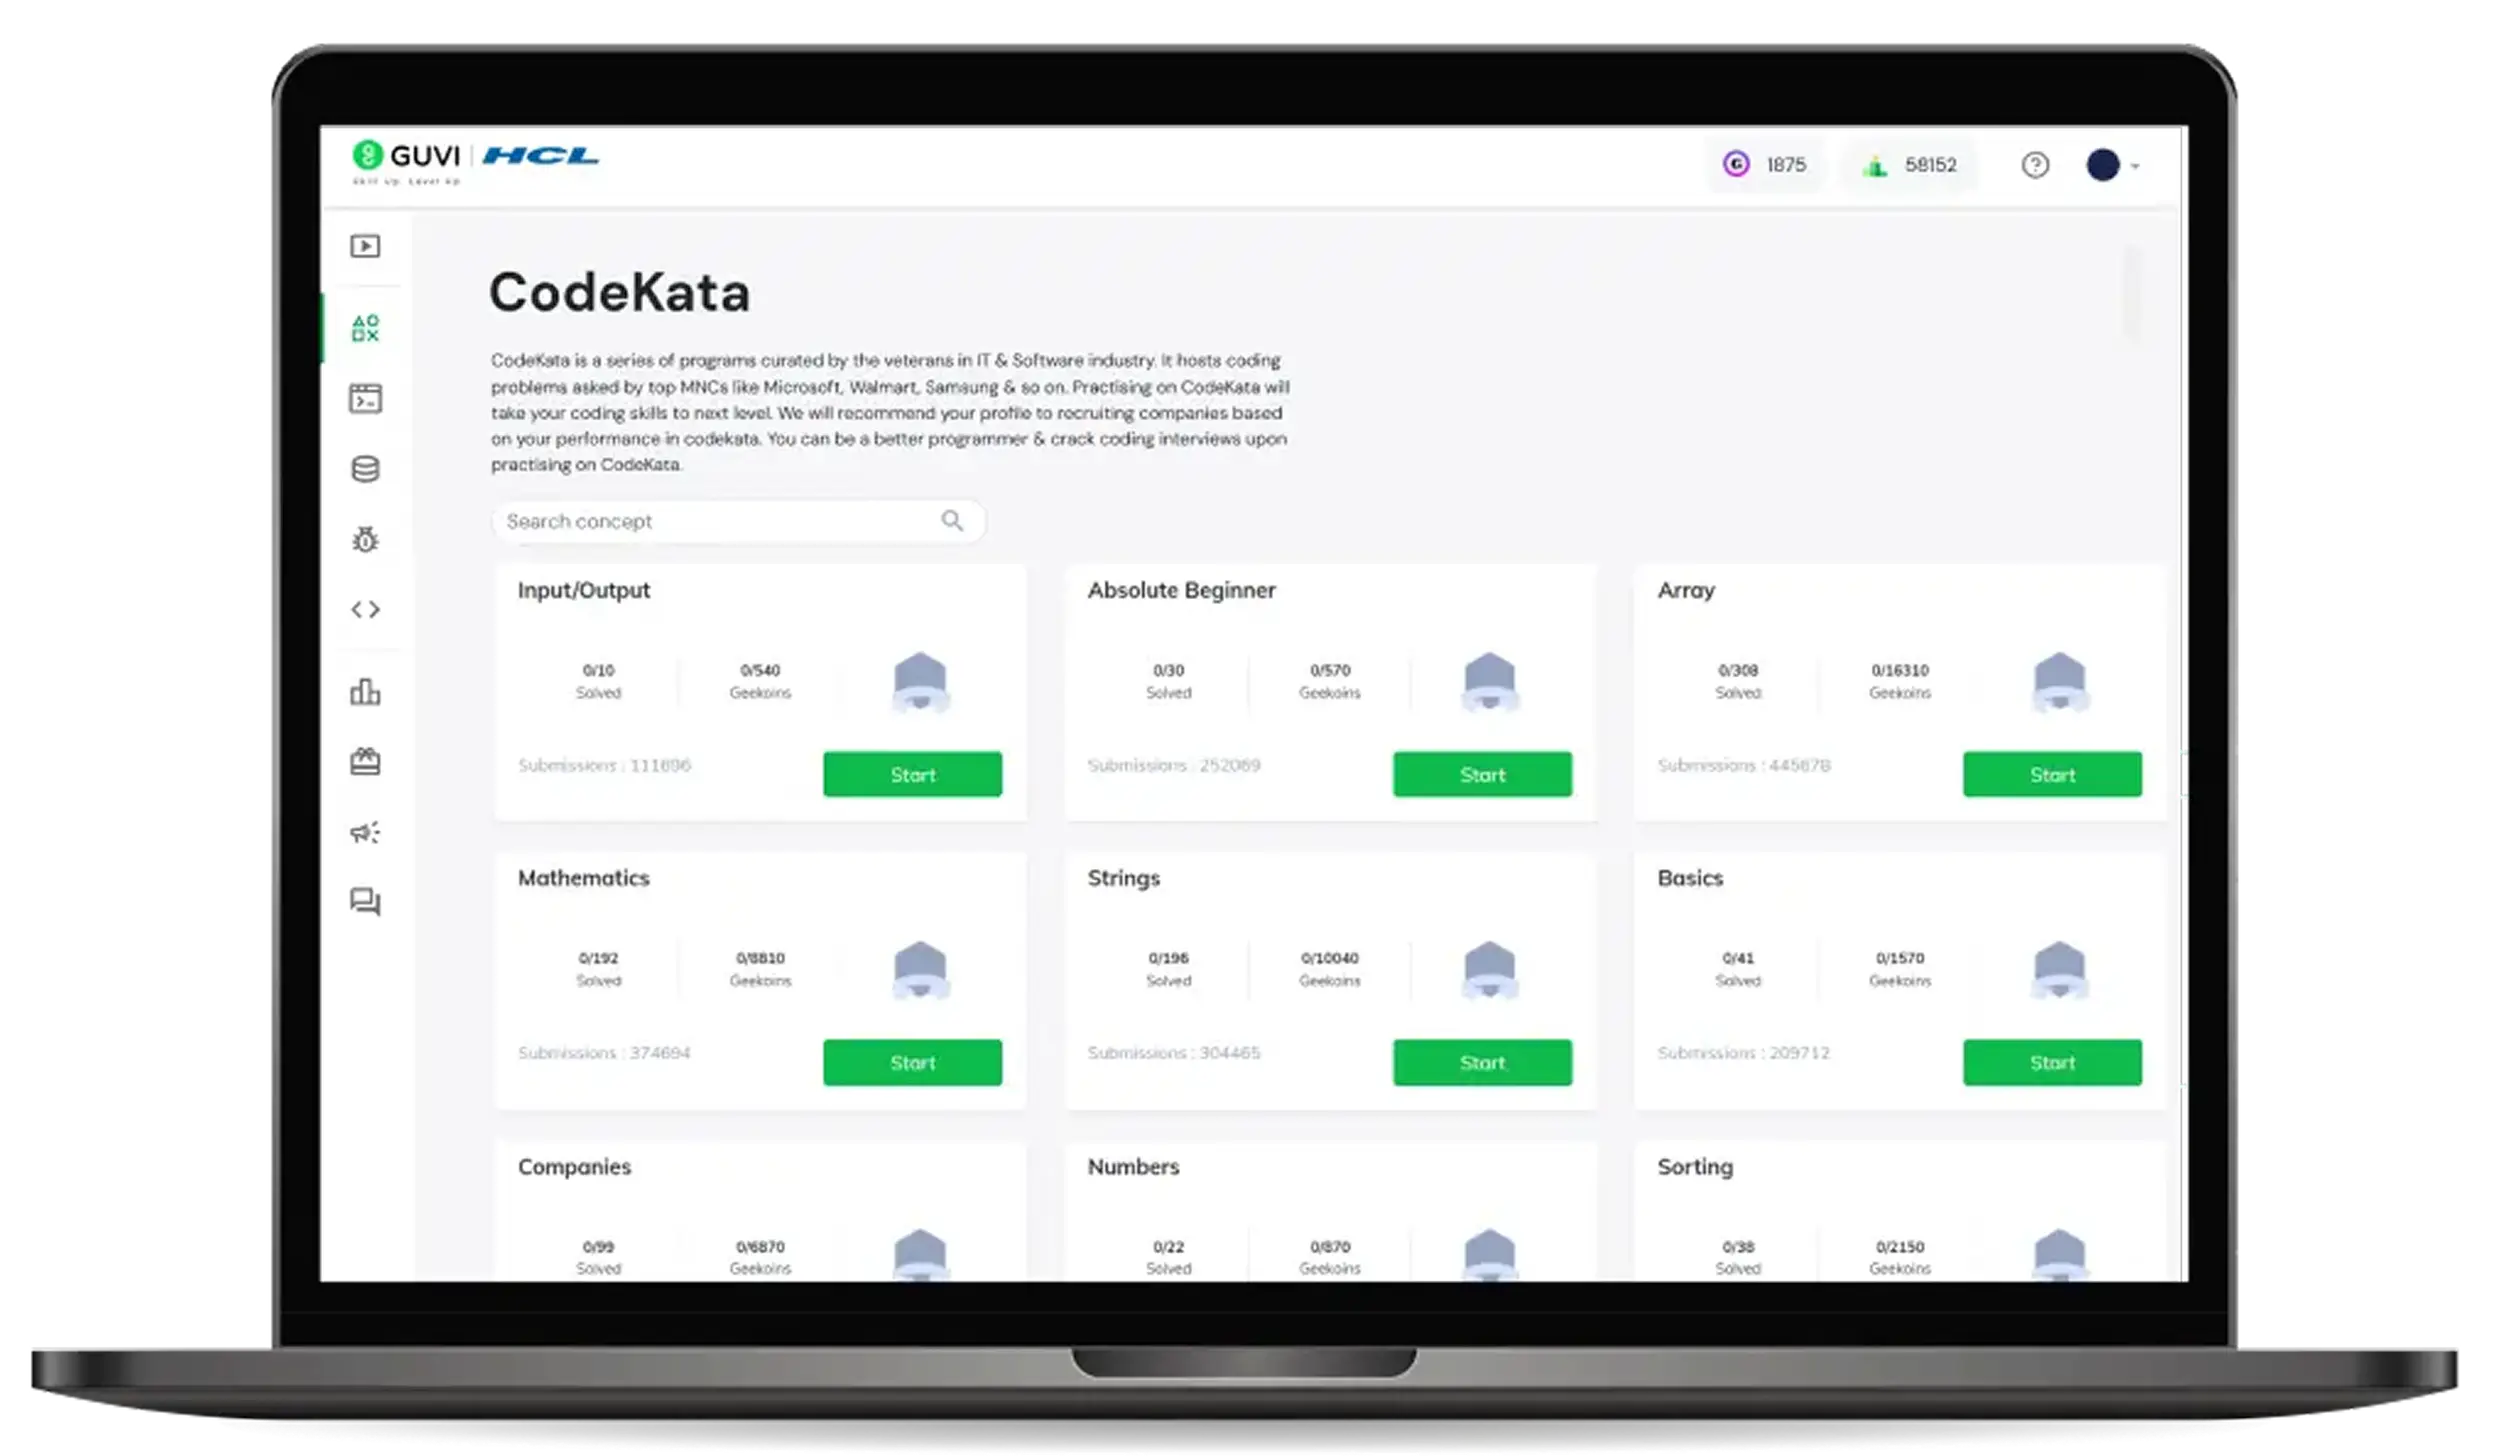
Bonus Features You Get

CodeKata

An interactive coding platform with 1500+ curated problems by IT experts. CodeKata tracks your progress and builds a coding profile to highlight your skills for job opportunities.
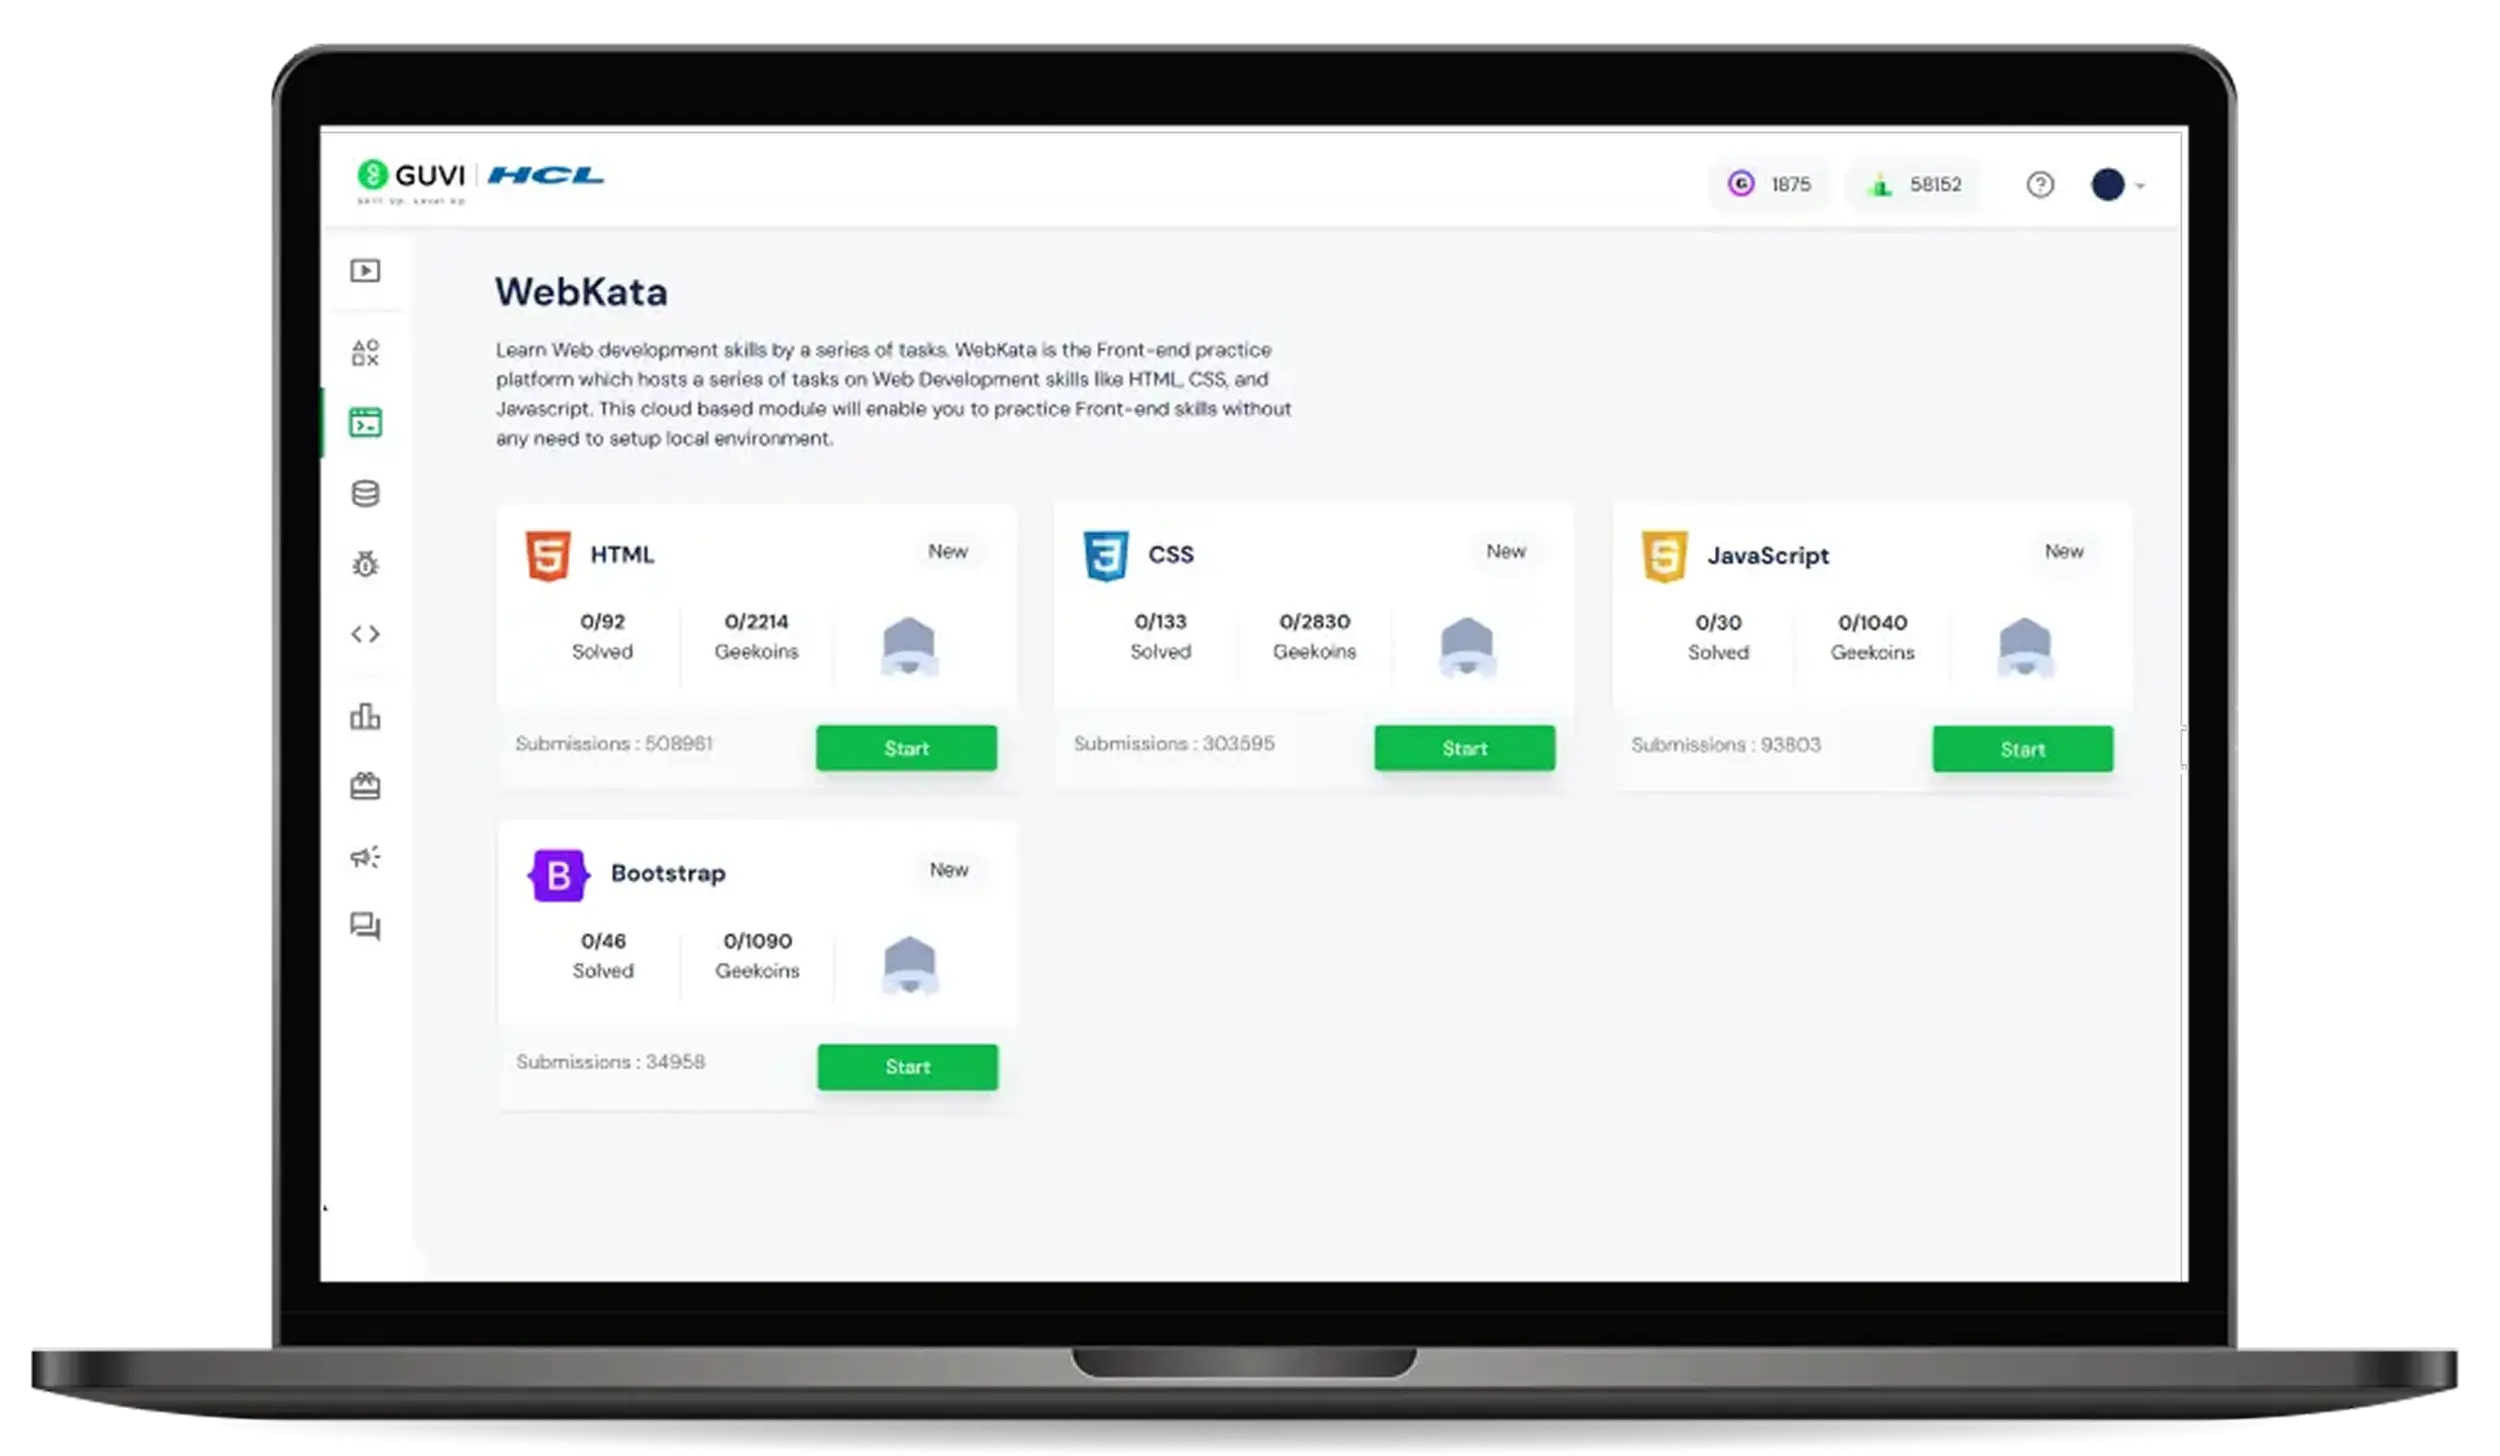
WebKata

WebKata is a developing practice platform for beginners, built with top-notch web development problem statements focusing on Modern HTML, CSS, and JavaScript. 
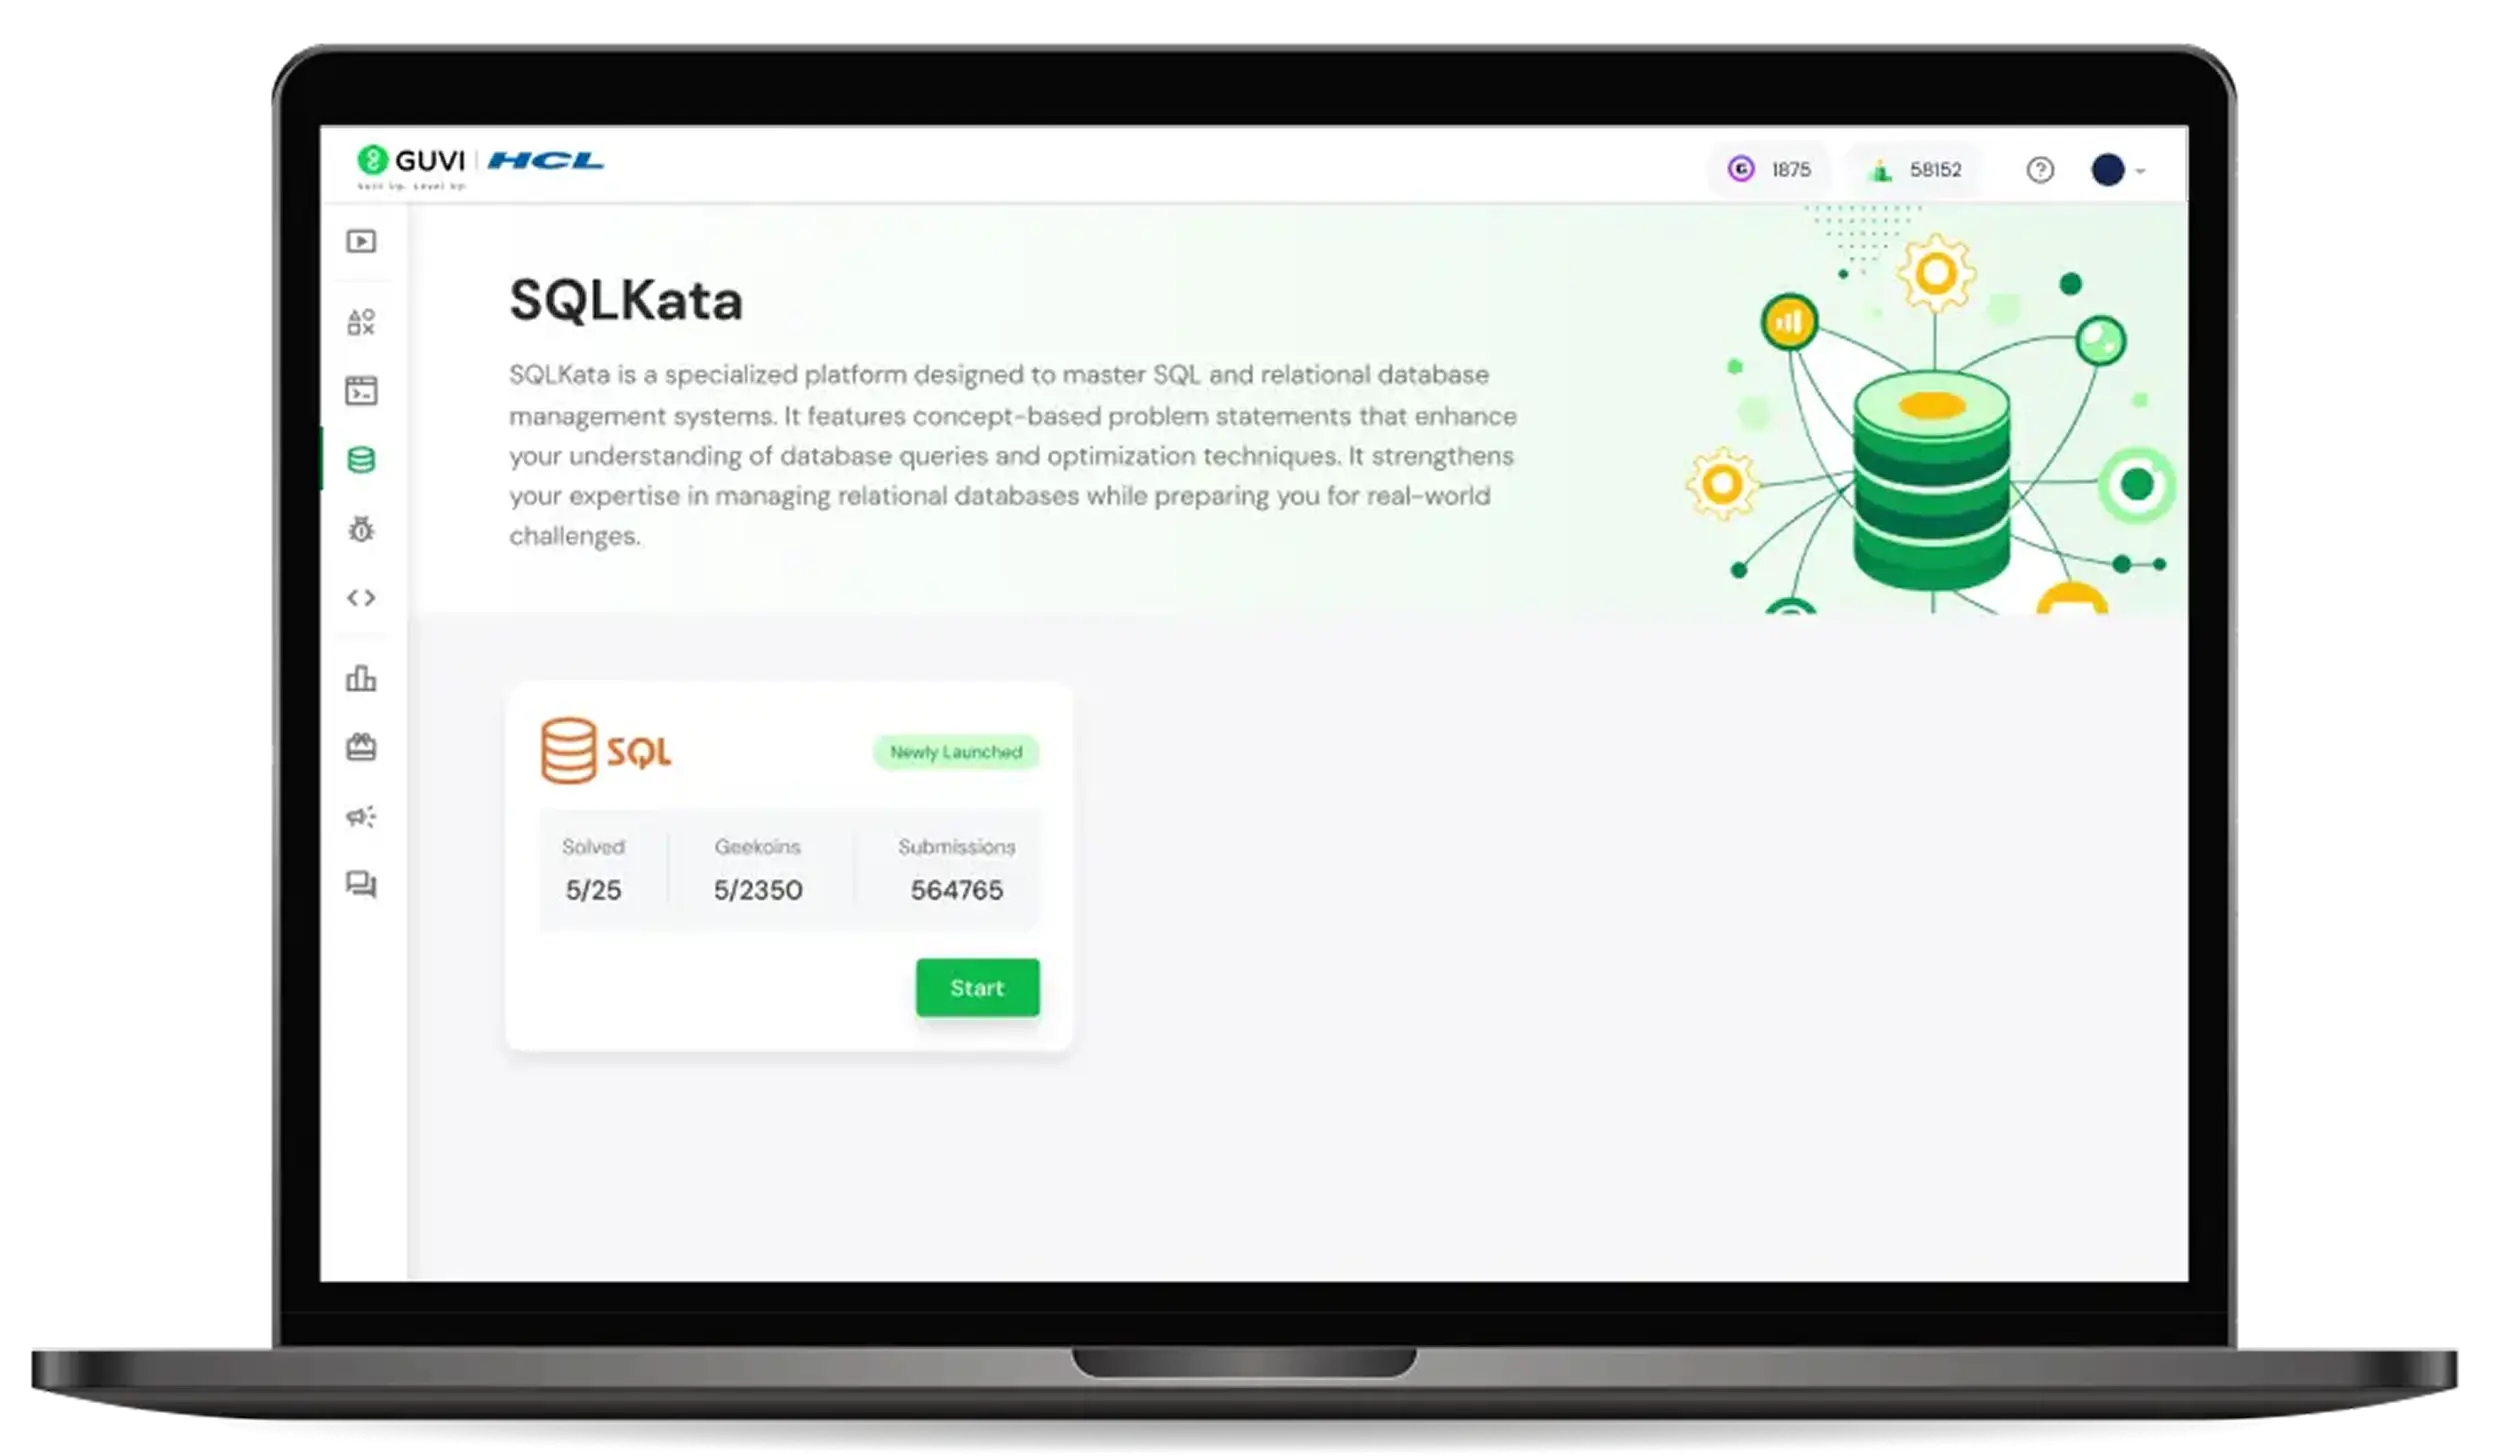
SQLKata

SQLKata is a hands-on tool to master SQL through concept-driven exercises. It builds skills in query writing, optimization, and real-world database management.
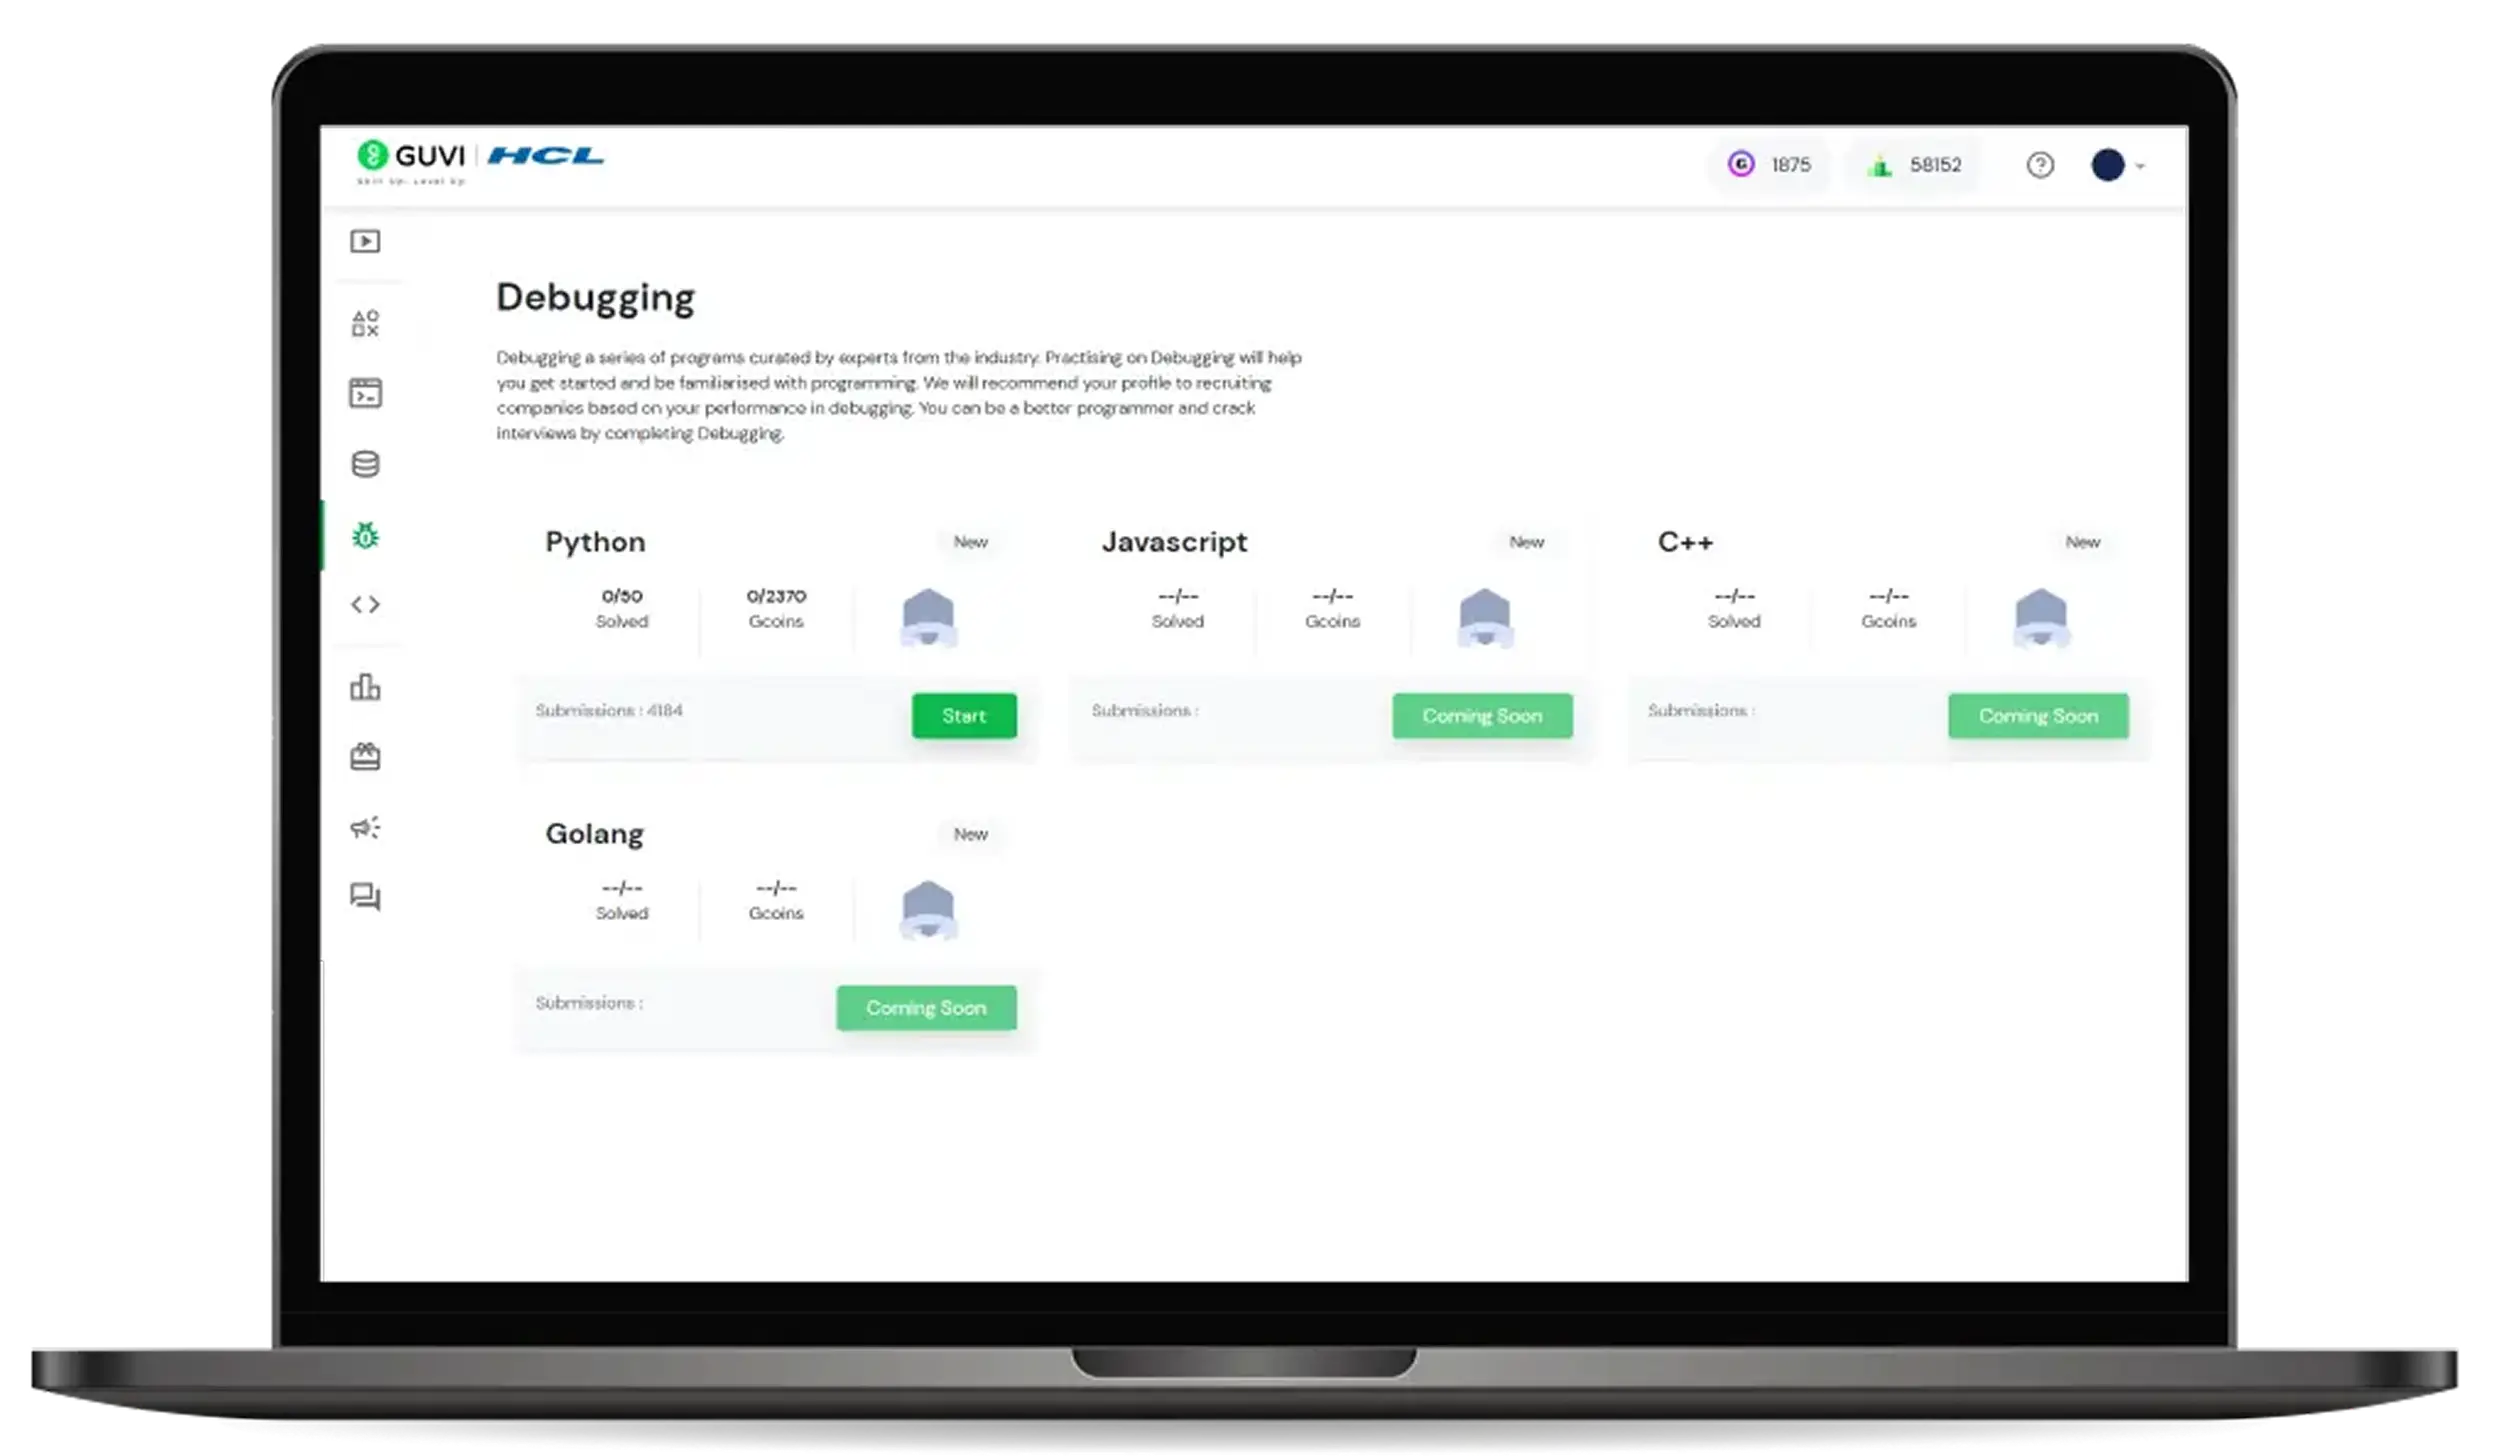
Debugging

Debugging a series of programs curated by industry experts. Practicing debugging will help you get started and become familiar with programming. 

What Our Learners Say

"You will be lucky to find quality courses on HCL GUVI. I must say that I was really lucky to get courses at such a low and discounted price. I got more than 9 hours of video and around 20 more resources to gain knowledge of programming. HCL GUVI provides a wide variety of courses both technical and non-technical. I suggest HCL GUVI is the best choice."

IT Analyst

"What makes HCL GUVI different is that it provides vernacular courses which make it easy to understand & practice platforms like CodeKata & WebKata, all these helped me improve my practical programming skills in the front end, back end. I highly recommend it if you want to get started with something new."

Software Developer

"I have opted for a combo-course that starts with the basics of the popular technologies and made me a pro in its domain... Codekata is very damn helpful to crack placements because it improved my efficiency in coding... we just need to be persistent and that’s all it takes. I am very happy to encounter HCL GUVI!"

Web Developer

Frequently Asked Questions

What do I actually get with this course?

You’ll get complete access to the IPL Cricket Analytics course, where you’ll learn Python, data analysis, and visualization using real IPL datasets. The course includes hands-on projects, real-world case studies, expert support, and a certificate upon completion.

Do I have to pay every month?

Nope! It’s a one-time payment of ₹499. No hidden or recurring fees.

How long can I access the courses?

 You get lifetime access, so you can learn anytime at your own pace.

Will I get certificates?

Yes. You’ll receive an industry-recognized certificate after completing the course, which you can add to your resume or LinkedIn.

Are the lessons live or pre-recorded?

All lessons are pre-recorded, giving you the flexibility to learn whenever it suits your schedule.

Will I get to practice what I learn?

Yes. You’ll work on real IPL datasets, hands-on projects, and practical exercises to build strong data analytics skills.

What if I’m not satisfied with the course?

We offer a 7-day money-back guarantee. If you're not satisfied, you can request a full refund within the first week.

Special Offer — Limited Time Only!

Get unlimited access to the IPL Cricket Analytics Course for just ₹499

Limited Period Offer

--
Days
--
Hours
--
Minutes
--
Seconds

Secure Your Career with Cricket Analytics Skills Today!

Start Your Journey to become AI engineer
Please fill all the required fields!
Please accept terms and conditions to proceed
Beginner Module :
  • Welcome to course
  • How to Setup Google Colab
  • IPL Dataset Overview
Advanced Module :
  • Feature Engineering for Deliveries
  • Team Performance
Expert Module :
  • Player Performance
  • Seasonal Analysis
  • Machine learning Model
Data Analytics Using Pandas
Beginner Module
  • Course Overview
  • Introduction to data analysis with Pandas
  • Loading and Inspecting data
Intermediate Module
  • Data cleaning & preprocessing
  • Selecting columns and rows
Advanced Module
  • Filtering Rows and Columns
  • Sorting and Ranking Data
Expert Module
  • Joins
  • Visualization
Intermediate Module :
  • Uploading datasets to Google Colab
  • Data Analysis and Cleaning
  • Feature Engineering for Matches
SQL
Beginner Module
  • Introduction
  • What is Database & about RDBMS
  • Need for Normalization (Anomalies) & cons
  • First Normal Form (1NF)
  • Second Normal Form (2NF)
  • Third Normal Form (3NF)
  • Boyce Codd Normal Form (BCNF)
  • About MySQL Database
  • Explore a MySQL Sample Database
  • DDL, DML, DCL & TCL
  • Databases & Tables
  • Insert & Select
  • Drop & Alter
  • Primary Key
Intermediate Module
  • Count & Sum
  • Update & Delete
  • Order By and Group By
  • AND OR Between In Like
  • Joins
  • Working with Dates
  • Auto Increment
  • Triggers
  • Index & Views
  • Commit & Rollback
  • Functions – MySQL & User Defined
  • Stored Procedures
  • Practical Session I
  • Practical Session II
Advanced Module
  • Capstone Project
  • Project Video
Excel Visualization
Beginner Module
  • Introduction to Excel Data Visualization
  • Basic Excel Functionalities & Merging data in excel
  • Table formatting and Conditional formatting
  • Advanced Conditional formatting
  • Module Booster - Excel - Beginner Part 1
  • Advanced Excel Functions
  • Advanced Excel Functions (Part 2)
  • Module Booster - Excel - Beginner Part 2
  • Searching and Filtering in data
  • Data cleaning using text functions
  • Styling Tabulation in Excel
  • Module Booster - Excel - Beginner Part 3
  • Excel Beginner Module Completion
Intermediate Module
  • Reading comlplex JSON files in Excel
  • Trendlines and Sparklines
  • Slicers and Pivot Table
  • Module Booster - Excel - Intermediate Part 1
  • Charts in Excel and Pivot Bar Chart
  • Clustered and Stacked Bar Charts
  • Box and Whisker Plot
  • Module booster - Excel - Intermediate Part 2
  • Area Chart & Stacked Area Chart
  • Distribution of Data - Histogram
  • Module Booster - Excel - Intermediate Part 3
  • Excel Module Intermediate Completion
Advanced Module
  • Dual Axis (Combo Charts)
  • Scattered Plot
  • Linear Regression Chart
  • Module Booster - Excel - Advanced Part 1
  • Pie Chart & Donut Chart
  • Gauge or Speedometer Chart using Donut Chart
  • Conditional Donut Progress Circle Chart
  • Module Booster - Excel - Advanced Part 2
  • Sunburst & TreeMap Chart
  • WaterFall Chart
  • Module Booster - Excel - Advanced Part 3
  • Excel Advanced Module Completion
Expert Module
  • Gantt Chart
  • Bubble Chart
  • Funnel Chart
  • Module Booster - Excel - Expert Part 1
  • Map Chart
  • HeatMap Chart
  • Getting Ready (Dashboard - Part 1)
  • Module Booster - Excel - Expert Part 2
  • KPI Dashboard in Excel
  • Interactive Dashboards with Slicers
  • Excel Expert Module Completion
  • Conclusion
  • Course Completion Excel

Hurry! This Exclusive Offer Ends Soon!

Get your IPL Cricket Analytics course now for just ₹499 (85% OFF!) – original price ₹9,999! Hurry, this offer is valid until 30th April , 2026.

--
Days
--
Hours
--
Minutes
--
Seconds
Matplotlib in Python
Beginner Module
  • Introduction to Matplotlib
  • Installing Matplotlib and dependencies
  • Setup - Jupyter Notebook
  • Getting started with basic of Matplotlib
  • Introduction to pyplot
  • Adding Labels to plot
  • Formatting plot style
  • Specifying axis in plot
  • Adding and customizing markers
  • Adding Titles and Legends to a plot
  • Scatter Plot and categorical plotting
  • Scatter plot in matplotlib
  • Plotting category categorical variables in various format
  • Line and SETP method
Intermediate Module
  • Figure and Subplot in Matplotlib
  • Concept of Figure and SubPlotting
  • Plotting multiple figure and plots
  • Applying Grids to the plot
  • More Plots in Matplotlib
  • Histograms in Matplotlib
  • Bar charts in Matplotlib
  • Pie Charts in Matplotlib
  • Stack plots in Matplotlib
Advanced Module
  • Logarithmic plotting in Matplotlib
  • Symlog and logit plot in Matplotlib
  • Polar plot in Matplotlib
  • Working with Time-series data in matplotlib
Expert Module
  • 3D Plotting and visualization in Matplotlib
  • Working with Audio data in Matplotlib
  • Working with images in matplotlib
  • Saving plots as PNG and PDF file format in Matplotlib
Plotly Dash
Beginner Module
  • Course Introduction
  • Flow Chart
  • Getting Started with Plotly
  • Getting Started with Plotly (AI-Enhanced)
  • Core Visualizations in Plotly - Part 1
  • Core Visualizations in Plotly – Part 1 (AI-Enhanced)
  • Core Visualizations in Plotly - Part 2
  • Core Visualizations in Plotly – Part 2 (AI-Enhanced)
  • Making Visuals Interactive & Presentable
  • Data to Story: Power of Clarity
  • Course Completion
Power BI
Beginner Module
  • Introduction of Power BI
  • Real Life Scenarios
  • Power BI Interface Overview
  • Connecting to Data Sources & Import vs Direct Query
  • Power Query:Cleaning , Shaping and loading data
  • Pivot and Unpivot
  • Append and Merge
  • Group By
Intermediate Module
  • Filtration and Conditional Column
  • Introduction of Data Modeling in Power BI -1
  • Creating Relationships in Power BI
  • Introduction of DAX
  • Basic DAX columns vs Measure
  • Filter Context vs Row Context
  • Calculate
  • All vs AllSelected vs Allexcept
Advanced Module
  • IF, Switch and Logical Operators
  • Text Functions
  • Date Functions
  • Time Intelligence Dax
  • Single Chart, Pie Chart, Gauge Chart
  • Linechart, Barchart, TOPN
  • Filteration and Edit Interactions
Expert Module
  • Bookmarks
  • Drill Up and Drill Through
  • Parameters
  • Custom Visuals
  • Publish the Report
  • Final Project -Loading and Transforming
  • Final Project -Modeling
  • Final Project -Calendar Table
  • Final Project -Measures
  • Final Project -Add Visuals
  • Final Project -UI/UX and Publish the Report
Power BI Dashboards with Python Data
Beginner Module
  • Python with Power Bi Introduction
  • Flowchart
  • Installing Power BI Desktop and Configuring Python Integration
  • Power Bi with Python booster - 1
  • Data Import using Python Script
  • Creating DAX Measures in Power BI
  • Power Bi with Python booster - 2
  • Building the Sales Analysis Dashboard in Power BI
  • Power Bi with Python booster - 3
  • Course completion Power Bi with Python
Please wait